Adjusting Stats to the Evolution of Scoring around the World.
A new era-adjustment technique.
I will not overdo the introduction for this, as many articles have been written on this topic before. You know that hockey is changing, and has changed many times in the past. Scoring 10 goals in a league somewhere does not mean you could have scored 10 goals a decade before. Maybe it gets easier, maybe it gets harder to score. The talent in the league might be improving, or decreasing, rules change, referring changes, etc.
So how can we compare the performance of a player in 2023 with one from 2008?
Until now, most of our fellow analytics people were using the Hockey Reference technique to adjust goals and assists for era. While we are grateful for Hockey Reference (without them we would not be using Win Shares), we decided to try our own thing here.
The first reason is that we look beyond the NHL, with about 50 leagues around the world in our database. The main consequence of this is that statistical reporting may vary from one league to another, especially if you go back in time 10-15 years. How many assists were reported per goal in some leagues around 2010 is… let’s say changing.
So era adjustment must be done separately for every league.
The second reason is that Hockey Reference technic is averaging out the adjustment over time, asking the question this way: “how’s the evolution of scoring 70 points looks like over time?”
What we suggest is to use today as the reference point: If player A scored 70 points in 2022-23, how does that compare with player B scoring 70 points in 2012? Which means era-adjustment will evolve every season as we will be using a new reference point.
Goal Scoring Trends
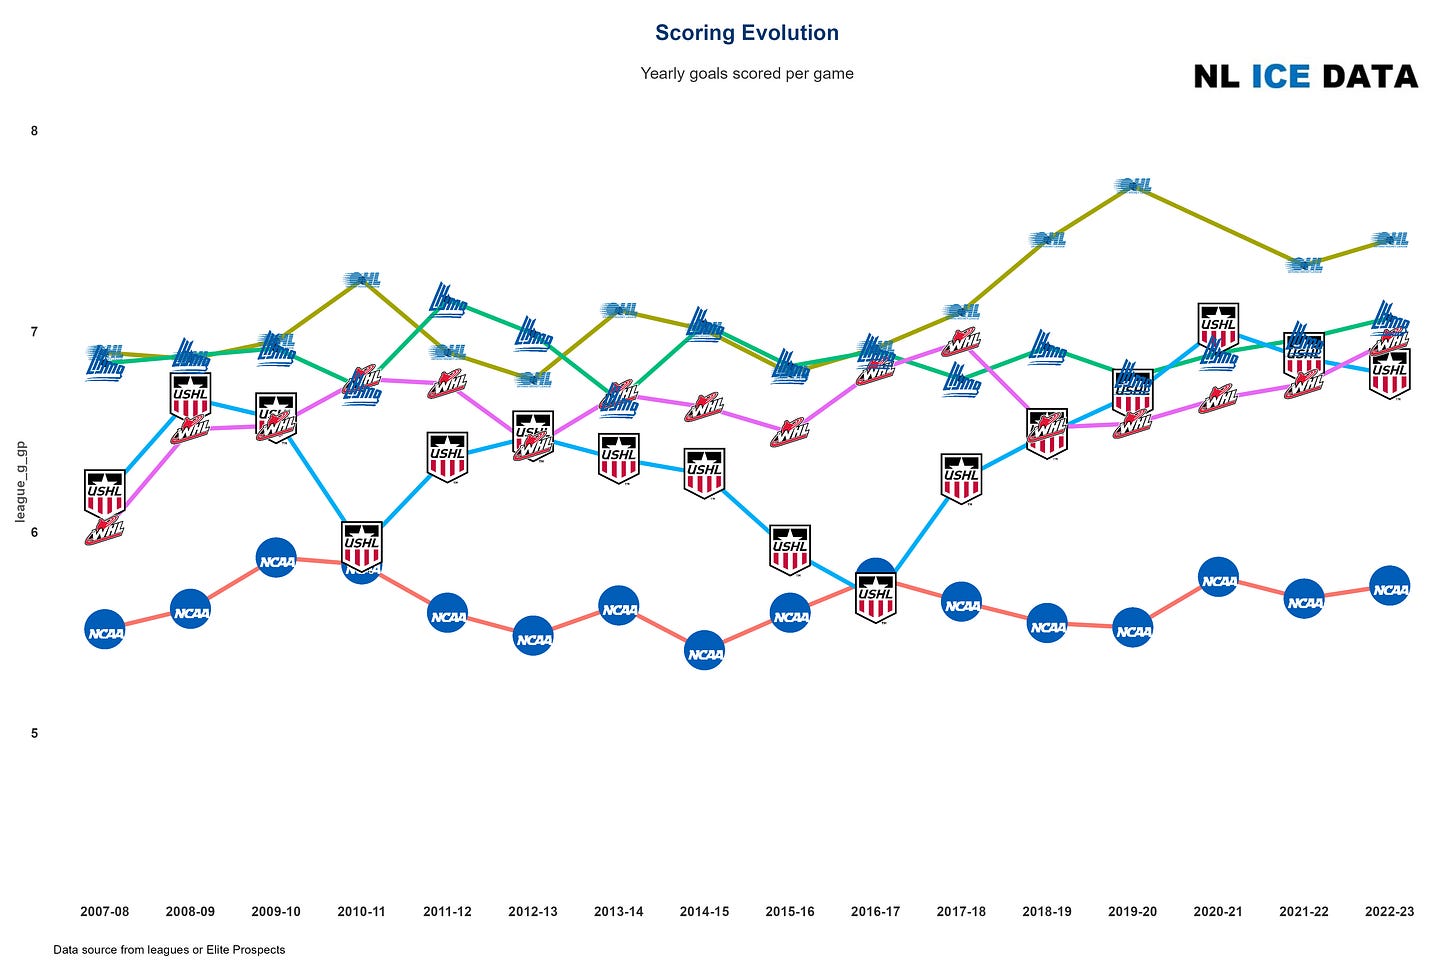
First thing you will notice is that the better the league, the less goals you tend to have… In the 705 seasons we have in our database, the lowest point for scoring was in the Russian VHL in 2016-17 with 4.72 goals scored per game.
Northern seriousness, right? The KHL, SHL, Liiga and VHL occupy the 25 lowest goal scoring seasons since 2008 with between 4.7 and 5.1 goals per game.
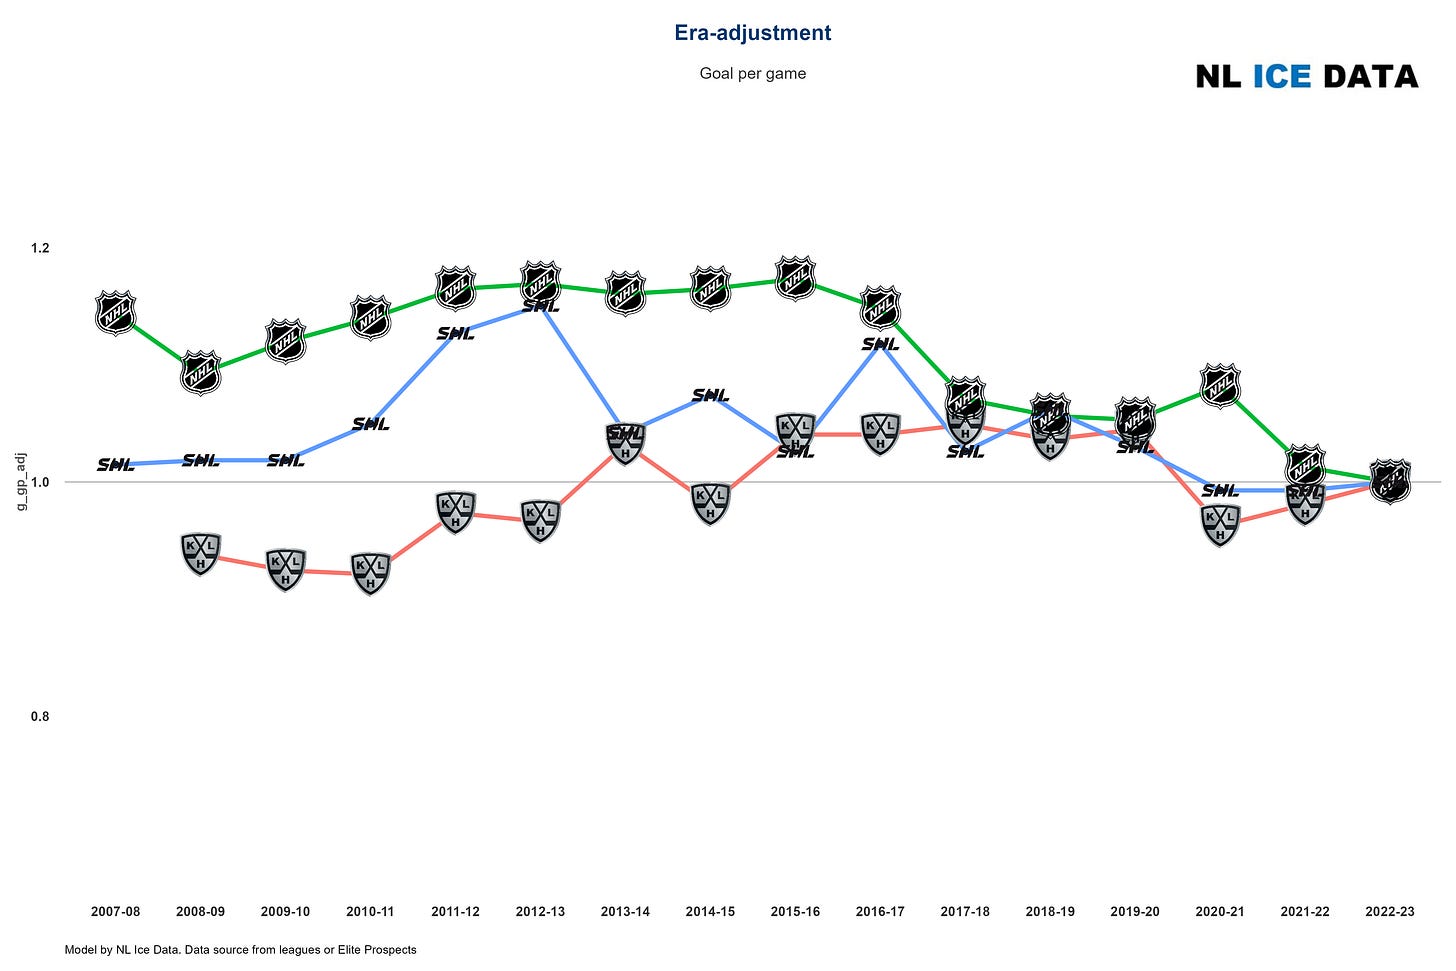
Also, while the KHL scoring rate kept dropping even more, before a recent rebound (due to the departure of foreign talents?), we know the current mood is into more goals. The NHL is going crazy, but the SHL for instance is following a similar steady raise as well since 2012.
Which is also true for leagues like the AHL, the Swiss NL or German DEL over the last decade.
On the other side of the spectrum, junior leagues tend to see more goals (bigger disparity of talent within the league? Less defensive structure? Worse goalies?) while some lower tiers leagues like Latvia or France 2 can get crazy with over 7 goals per game.
Era-adjustment calculations
What we did is pretty simple.
First, everything needs to be put into a “per game” perspective of course, as leagues regularly change the number of games played per season.
Calculate the sum of goals and assists reported for a league that season.
Then calculate the average number of assists per goal.
Ex: 6.36 goals were scored per game in the NHL in 22-23, compared to 5.56 in 07-08.
Use 2022-23 as a reference and divide the goals per game of 07-08 by the goals per game of 22-23: 6.36 / 5.56 = 1.14. One goal in 2023 is worth 1.14 goal in 2008.
There were 1.68 assists per goal in the NHL in 22-23, compared to 1.71 in 2007-08.
1.68 / 1.71 = 0.98. There are slightly less assists per goal in 2023 compared to 2008.
To get the adjustment for the number of assists per game, simply do the goal adjustment * assist adjustment: 1.14 * 0.98 = 1.12. One assist in 2023 is worth 1.12 assist in 2008.
Here the goal adjustment for the NHL, SHL and KHL.
So if there was less scoring before, you will end up with an adjustment above 1 compared to 2023. And below 1 if there was more scoring in the past.
Rolling back the database, each player gets his stats modified with the adjustment for goals, assists, then adjusted points become the total of both.
Hence, Alexander Ovechkin 65 goals, 47 assists and league leading 112 points in 07-08 would be adjusted to 74 goals, 53 assists and 127 points in 2023 currency.
A quick look at junior leagues also give a good indication that an increased scoring rate everywhere mean past performances need to be put into perspective with a boost in adjustment before being compared to 2023 stats.
What’s next?
Having the database era-adjusted mean revisiting the history of every player, possibly changing the perspective on career trajectories, league’s strength, etc.
The best example is looking at the KHL. Everybody tends to say the KHL is not what it used to be (and that KHL prospects need to be taken with an asterisk). But, if scoring is going down in recent years, it actually means that scoring is getting harder to get in the KHL. So in order to form a full picture of a league’s strength we need to extend the analysis to how that league is trending in relation with other leagues.
Which means, looking at era-adjusted NHLe basically… We will tackle that on the next article!
Quick note, Win Shares do not need to be era-adjusted, simply because there will always be 1 Win Share available per game, to be shared between players, no matter the scoring. Win Shares calculations will be using non-adjusted stats.


