Those past few years, stats have been one of the most important innovations helping us rethink the game of hockey. And if the primary focus has been player evaluation, from pre-draft scouting to career analysis, stats are also more and more helping coaches build in-game strategies. We can cite Ryan Stimson and his work on plays from behind the net or his book Tape to Space in general or we could simply think about how coaches can use thousands of data points to manage faceoff matchups according to historical confrontations, left or right, offensive or defensive zone etc.
About zone entries
Some of hockey greatest tactical battles happen between the two blue lines. Going over those blue lines enables you to move from defense to offense or deny the other team to do so.
Regarding zone entries, previous researches have showed that the difference between a controlled entry and a dump-in is about two for one. Corey Sznajder presentation at RITSAC 2018 gave 0.66 shots per carry-in versus 0.29 shots per dump-in. In our database of 56,700 zone entries, built from manually tracking games in Switzerland National League since 2019, 47% of controlled attempts have led to a shot, versus 18% of dump-ins (excluding dump and change). So, the two for one difference (or more) looks pretty much universal, small ice or big ice, and no matter the stat you look at.
To say that controlled entries are more dangerous is nothing new. But here comes the little voice you may have heard hundreds of times around the hockey community: “Yes, but if you create a turnover at the offensive blue line, you are in big trouble, when dumping-in at least gets you inside and keeps you safe”. We were analysing zone entries with a coach last year and as I was pushing for less dumping, he brought up the “risk argument”. And as we were debating it, he had the only logical request any smart person would have and told me: “prove it to me it is not riskier”.
Luckily, the work I have done the past years on Sequences can bring some answers. A Sequence extends from the moment a team gets control of the puck and starts moving forward, to the moment the team loses it for good. It has a total value in Expected Goals from the sum of all shots that might have happened inside that Sequence, and 0 if no shot occurred.
Which also means that if Team A has a Sequence that includes a zone entry, I can know what happened in the next Sequence when Team B got the puck back…
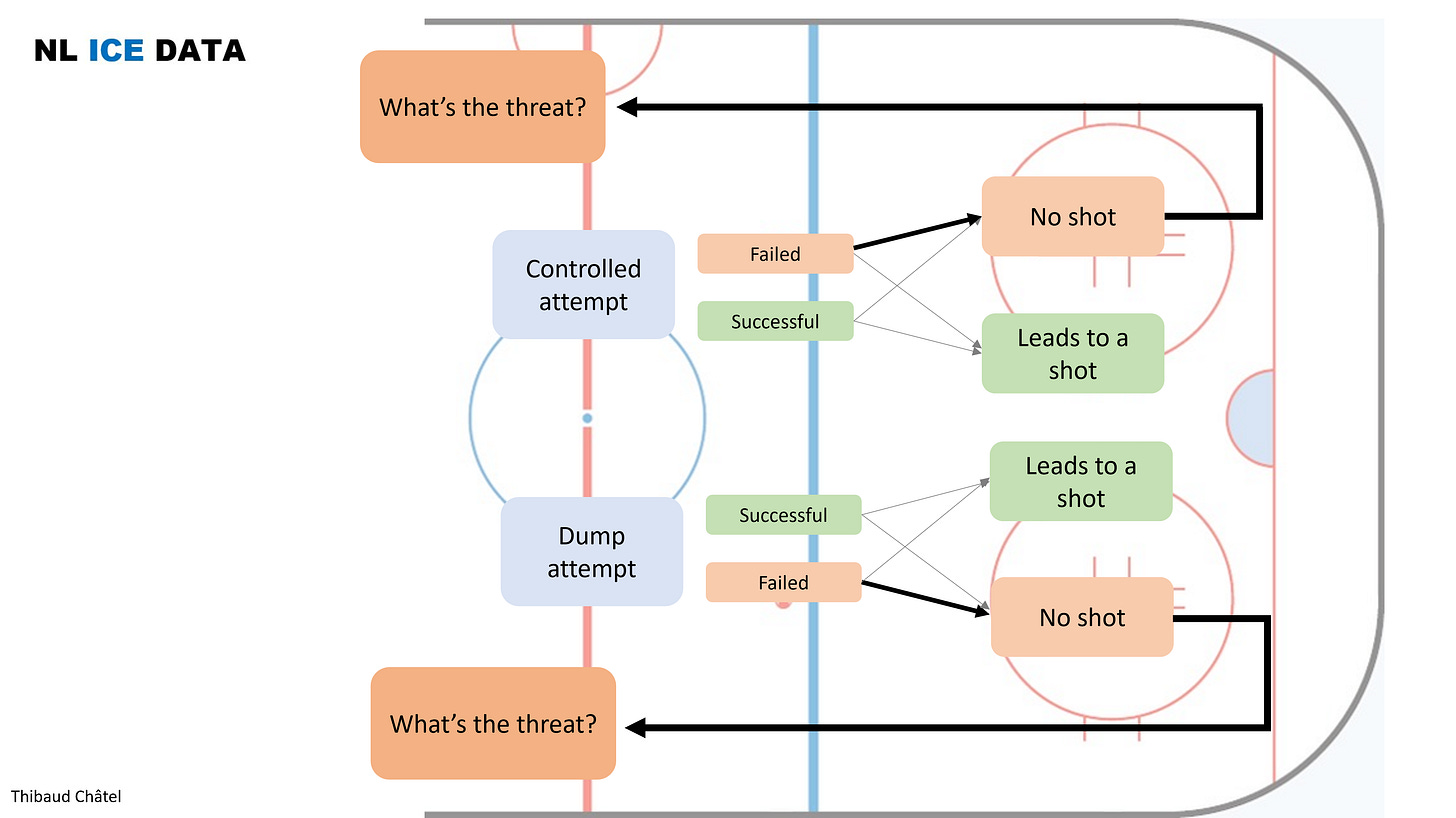
Now, we can look at the full sample, and we should, as the probability of success of an attempt impacts the level of risk for what happens next, including against your team. But as you can see on the map above, we need to focus on immediate turnovers, so removing all sequences where the attacking team created a shot, even after a failed entry.
What happens after a zone entry?
Let’s look at the numbers. We have over 56,700 5v5 zone entries in our database, all tracked manually in Switzerland since 2019. In our tracking, we identify either controlled or dump attempts. Then Successful or failed entries. A successful dump is recovered by the attacking team immediately or after the first battle for the puck.
First, let’s look at how many entries led to nothing for the attacking team, and only give the defense the opportunity to counterattack.
And no surprises here, failed entries, either controlled or dumped just gave the puck back to the defending team over 90% of the time. Over 55% of successful dumps still didn’t lead to a shot for the attacking team when it is down to 40% for successful controlled entries (so 60% of controlled entries led to a shot by the way).
Now, it is one thing to lose the puck deep in the zone but it’s another business to lose it at the blue line, right?
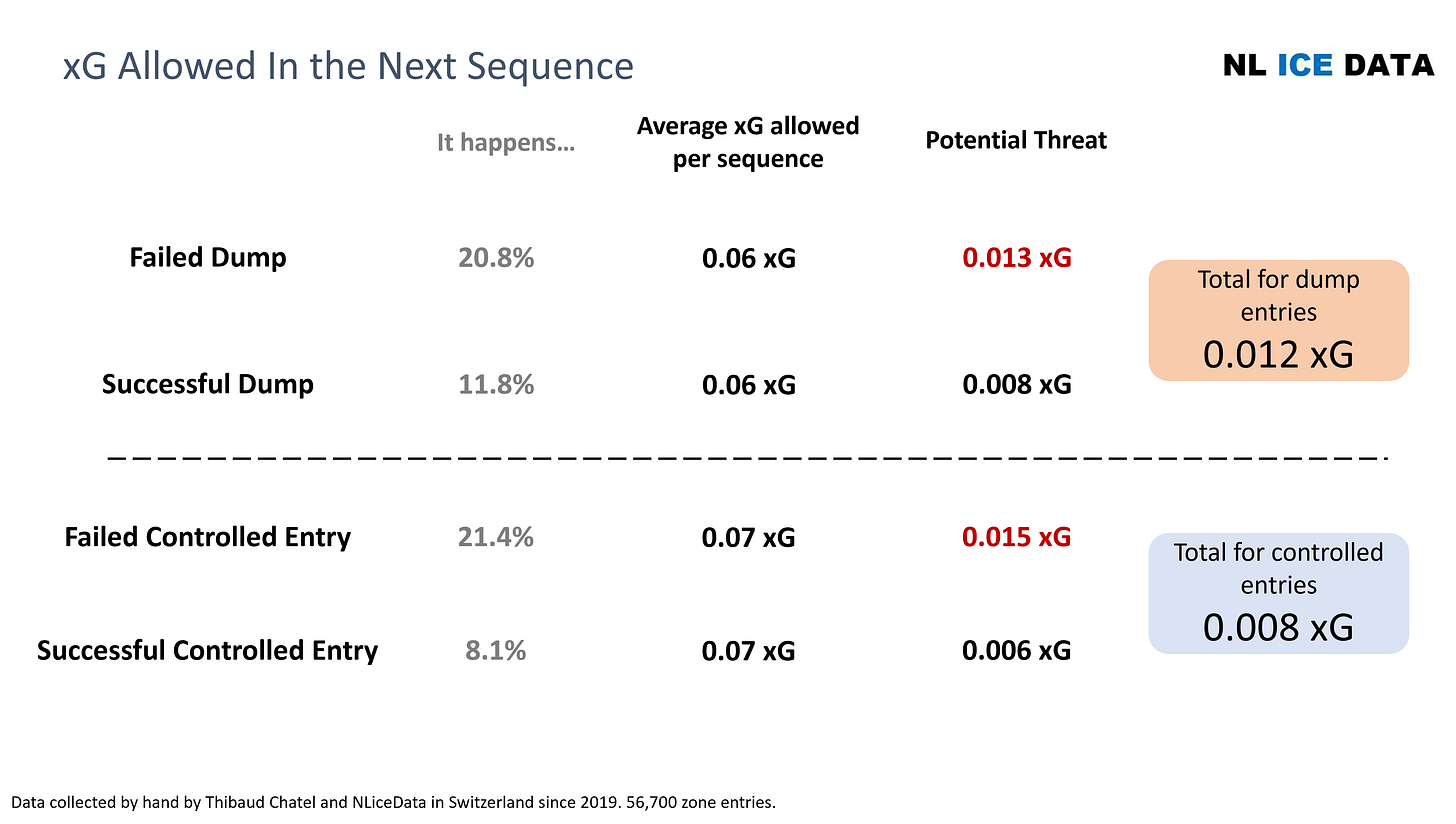
But the truth is, there’s no difference between a failed dump and a failed controlled entry. They will both lead to a shot against you 21% of the time. A successful dump will lead to a shot against you 12% of the time and a successful controlled entry only 8% of the time.
So here, the common wisdom about failed controlled entries is right. They are the most probable to lead to a shot against you. BUT that would be forgetting that for such a scenario to happen, you first need to fail your entry… And in our database zone entries tried in control are successful 75% of the time. When dump-ins are successful 25% of the time.
Moreover, it also makes sense to take a step back and consider the potential outcome BEFORE knowing if your entry will succeed or fail.
Because as your player is going to choose between a controlled or a dump entry, he doesn’t know if he is going to be successful yet. So, back to the moment of truth, opting for a dump attempt will lead to an immediate shot against you 19% of the time. And it is 11% for a controlled attempt. Almost twice as less dangerous.
What about quality?
Here comes the little voice again, saying: “yes, but there is a major difference between not retrieving a dump, and allowing an odd-men rush because you lost the puck at the blue line”. One shot allowed after a failed dump and one shot allowed after a turnover at the blue line is not worth the same.
To answer that question, we can look at the Expected Goals (xG) created on such occasions. We are using our own xG model here, based on shots manually tracked in Switzerland since 2019. The model also includes variables showing if a shot is taken off the rush, if a high-danger pass or a play through the Royal-road was made. So, any odd-men rush situations and plays against a non-set-up defense would be reflected in the xG.
First of all, if we look at the average xG allowed by the attacking team in the next sequence after losing the puck, all scenarios (dump or controlled entry, successful or failed) give up on around 0.06 or 0.07 xG to the opponent. Which is a first interesting finding, showing that losing the puck after a controlled entry is not riskier after all.
If we take the probability of losing the puck right away, allowing a shot immediately, and the average xG allowed, a failed controlled entry is still the biggest threat, with a potential 0.015 xG against you, but very close to a failed dump that has a potential 0.013 xG against you.
Now, let’s take one step back again, before the decision to try the entry in control or by dump was made. And once again, the probability of allowing a counterattack is the decisive variable here. So, deciding to go for a controlled attempt, that has a 75% chance of success as we mentioned earlier, means that the threat against you is 0.008 xG. When deciding to dump the puck means a threat of 0.012 xG, a 33% more dangerous move.
Conclusion
These numbers are obviously averages over thousands and thousands of individual situations. The way the other team is defending its blue line will impact the player’s decision to dump or not, as will his fatigue at the time, the position of his teammates, etc. But over time, these numbers still show non only the added value of trying to enter in control, but also the lower risk it means for your defense. Because we might remember goals allowed on ugly turnovers at the blue line, but nobody think about the dozens of possessions just handed over to the other team when you are dumping the puck. And this is where, once again, numbers can reassess perceptions of what we think we know about hockey.
Liked that post? Please subscribe and consider supporting us with a coffee !
You can also follow me on Twitter pages here and NL ice Data here


