
How goalies stop pucks does not matter
Just stop them...

If you miss our previous articles on scouting goaltenders with analytics, it’s here
Having access to more stats and deeper information is a blessing. It could also become a curse if we don’t pay attention to how we use them.
One part of the analyst’s job is to carefully examine the story stats can tell, and avoid jumping to tempting conclusions. One misleading trap is that, sometimes, good numbers on one specific aspect of the game does not mean the player is having a good impact overall. You can be good at something but average overall. And you can be bad at something and great overall.
It is especially true with goaltenders, a certainly complex position… Goaltenders are voodoo and all.
Shot control
Goalies prevent goals from happening. But we often hear about different styles of goaltending, related to size, athleticism , techniques, etc. Does that mean goalies stop pucks different ways? Is there one stat that would be more telling than others to predict a goalie’s success?
For this we can track the outcome of every shots on net. Working at the time with Michael Lawrence, goalie coach for the HC Lugano and head instructor for Pro Goaltending, we identified four possible outcomes for a shot on goal: a kill , a controlled rebound, an uncontrolled rebound, or a goal allowed.
Goal allowed does not need explaining…
A Kill basically means the save will be followed by a whistle. Either the goalie swallowed the puck or sent it out of play.
A Controlled rebound means the goalie made the save and sent the puck out of danger, basically outside the homeplate, where, no matter who gets the puck first, nothing can happen anymore.
An Uncontrolled rebound means the goalie made the save but the puck staid inside the homeplate, where an opponent could grab it for a second chance. It is obviously better than allowing a goal but the defense is not out of the woods yet (though they clear it in the example below).
Adding up Kills and Controlled rebounds gives us “Controlled saves”. For which the league average in Switzerland is 66% (28% of Kills and 38% of Controlled rebounds), for 34% of goals and Uncontrolled saves.
Now, does that tell us anything about goalies overall? An article from The Athletic in November 2021 presented an opinion that Kills (or “Freezes”) could have a very strong correlation with simply being a great goaltender. The statement made us tick at the time based on our day to day knowledge of the stat and we finally found time to crunch the numbers.
Linking saves and overall performance
Goals saved is the best way to evaluate the overall performance of a goaltender. It is simply the difference between the goals allowed and the Expected Goals faced. This season, Igor Shesterkin faced 140.1 xG according to Moneypuck.com and allowed only 106, for 34.1 goals saved.
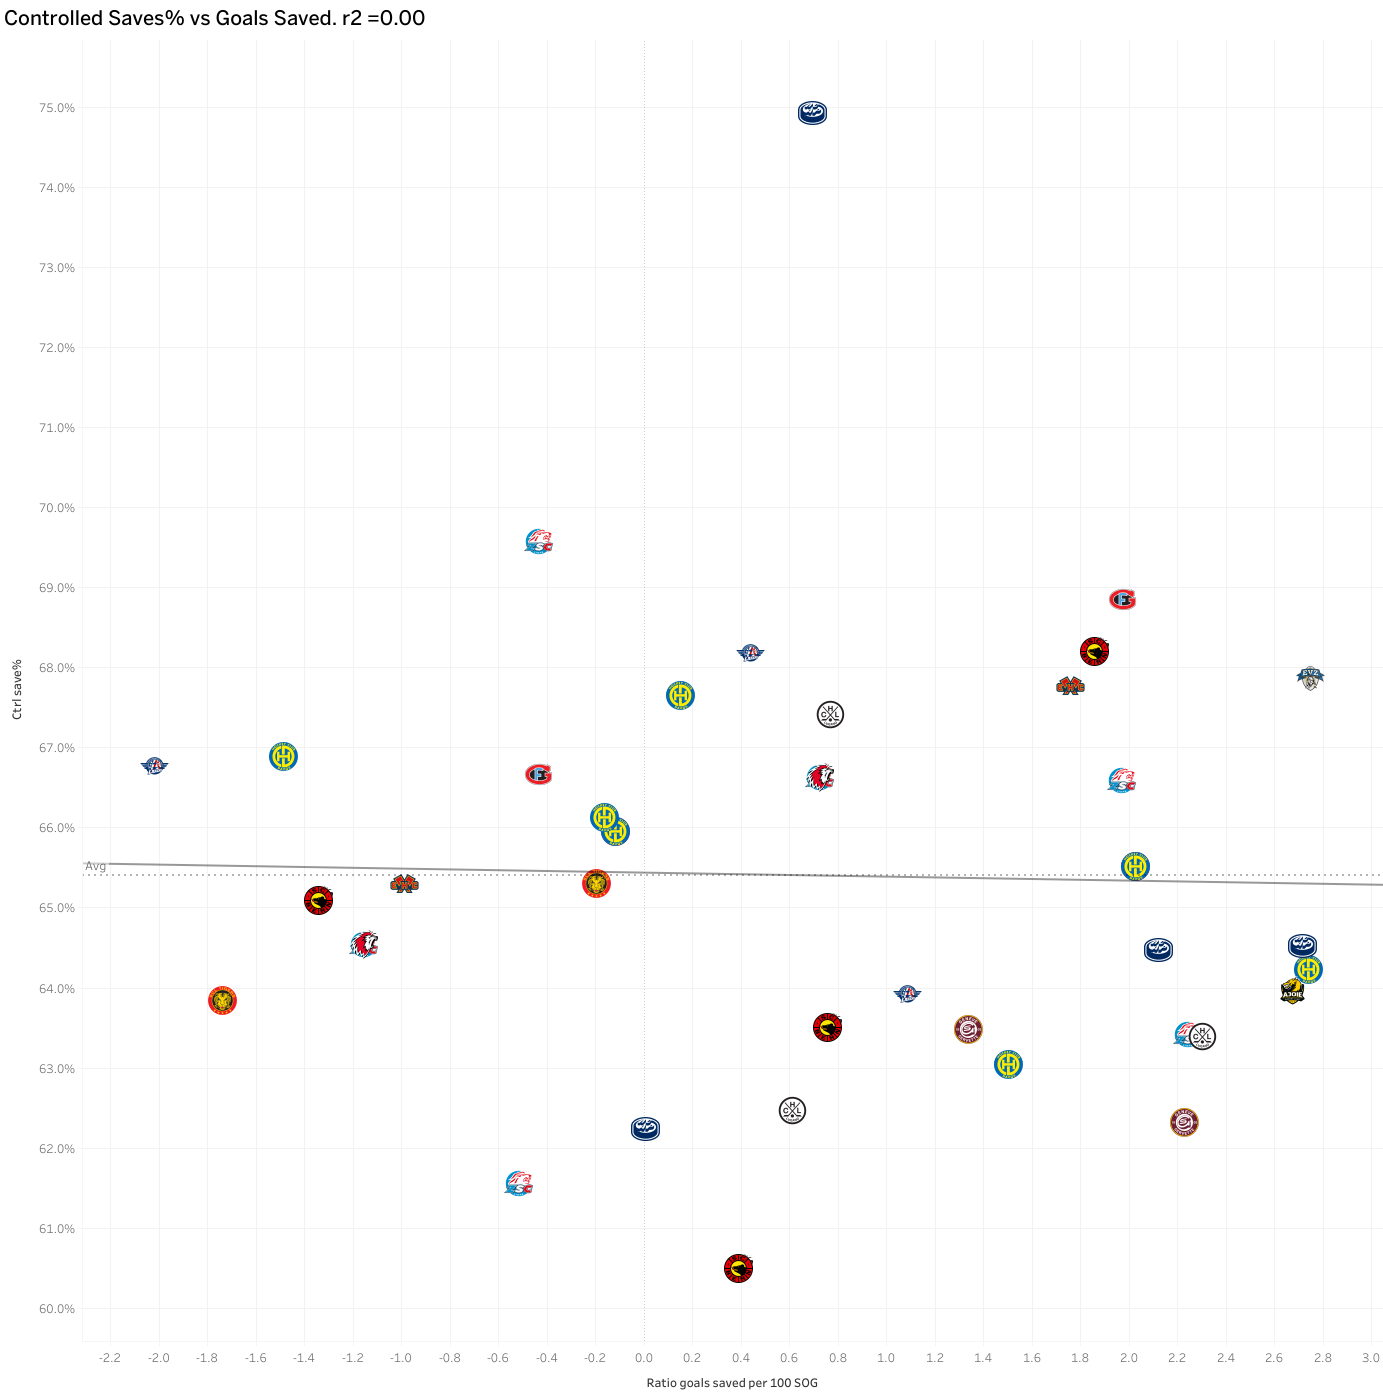
Let’s look at the data we manually collected in Switzerland over the last two seasons, for any goalie that faced at least 250 shots on goal, which seems to be the barrier between occasional goalies and regular back-ups and starters. To put all goalies at the same level, regardless of the number of games played, we looked at goals saved for every 100 shots faced here.
The statistical link between having a good Controlled saves% (Kills + Controlled rebounds) and saving goals is simply non-existent. Goalies with a great Controlled saves% allowed more goals than expected and goalies with a low Controlled saves% saved goals in the end. Anything is possible.
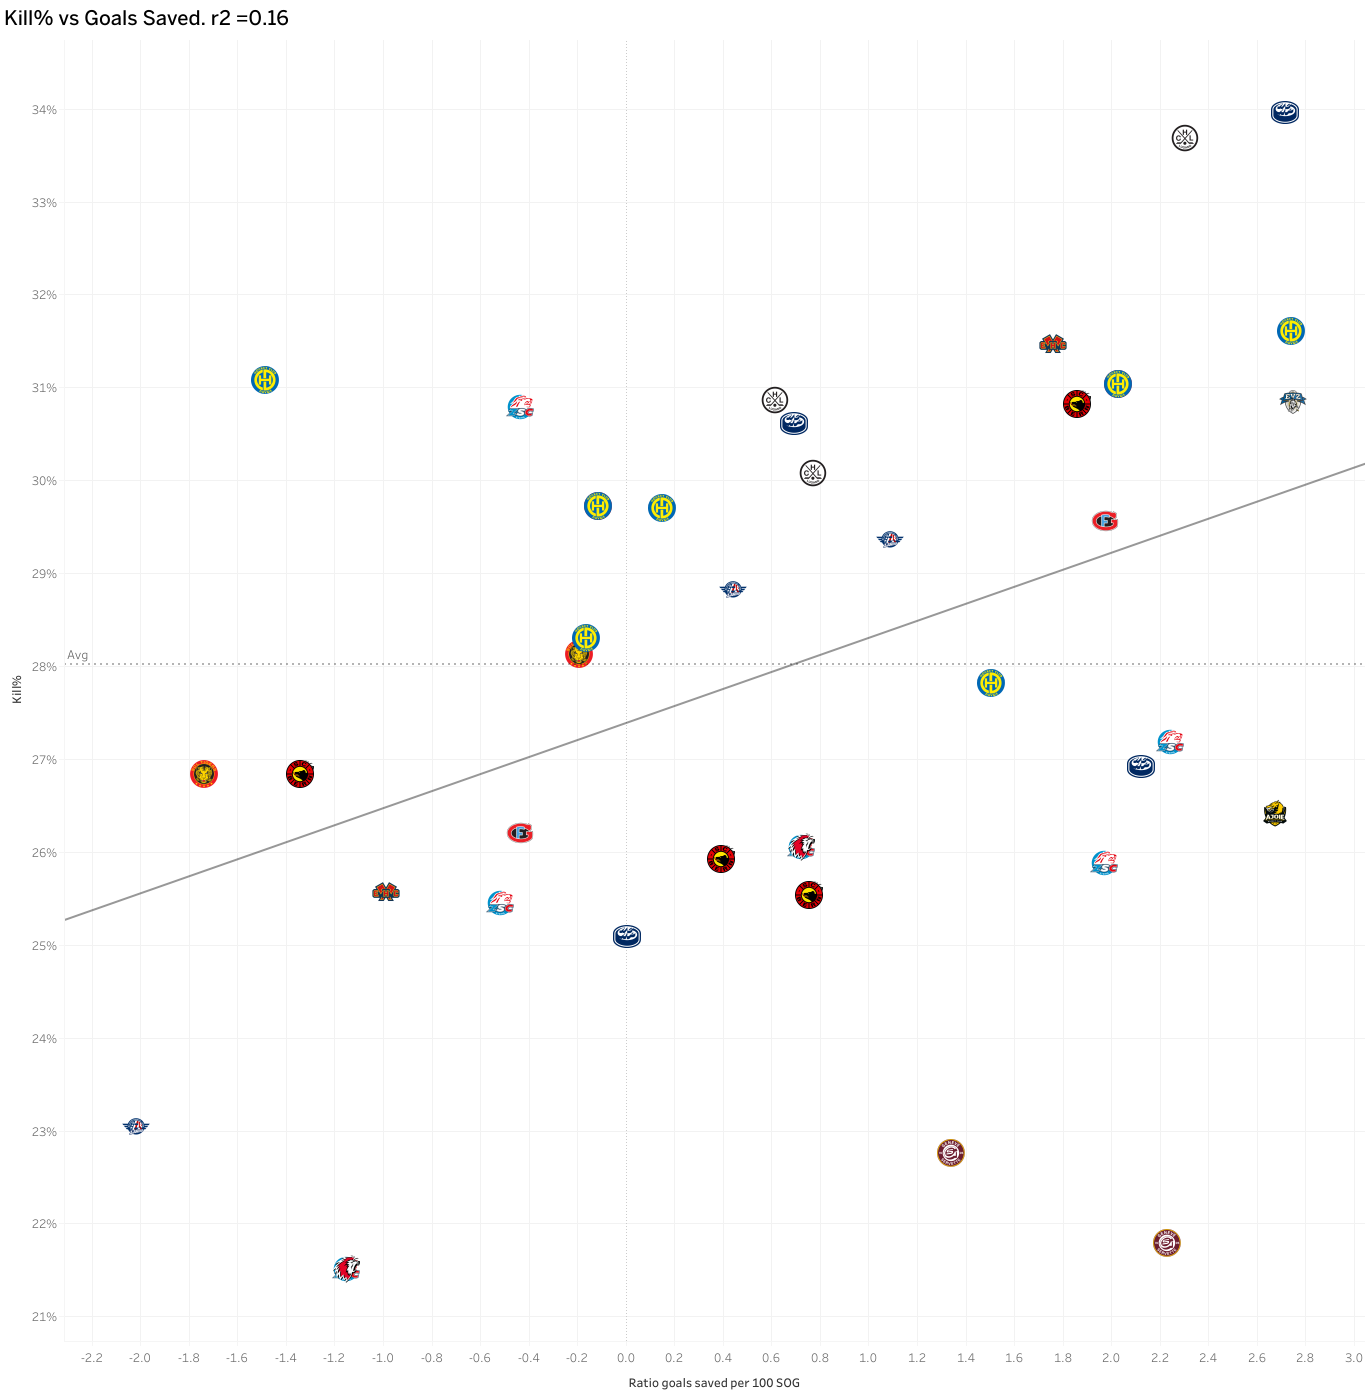
Moving on to Kill%, things appear to make more sense, but a r2 = 0.16 is still far from being meaningful it only implies that 16% of the goals saved are explained by the faculty to kill pucks. Goalies that kill pucks more often tend to be better goalies but that’s pretty much it.
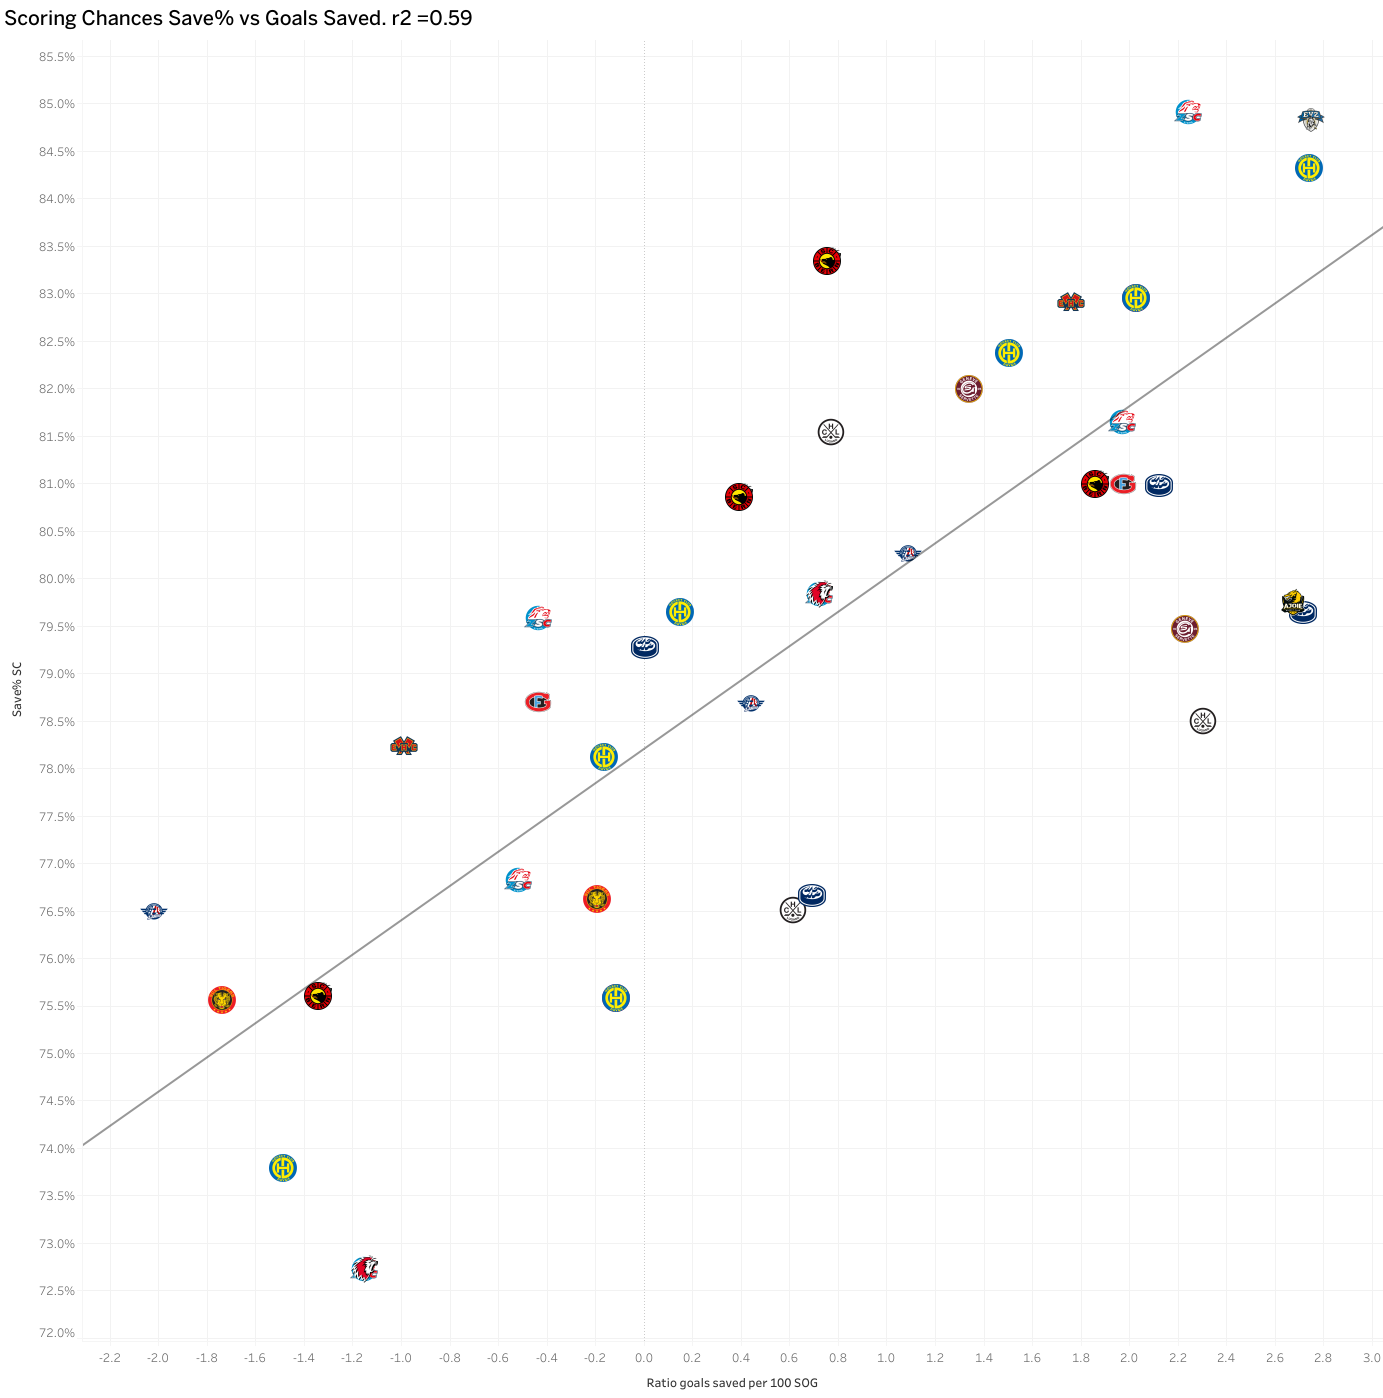
If we forget the type of saves they made, just focusing on if they either stopped the puck or not, the story is now writing itself. Looking at the save% on Scoring chances, the correlation with saving goals is now pretty strong (0.59). And it make sense, as Scoring chances are the most valuable shots in xG value. If you stop them, you tend to prevent goals from happening, now matter how you do it.
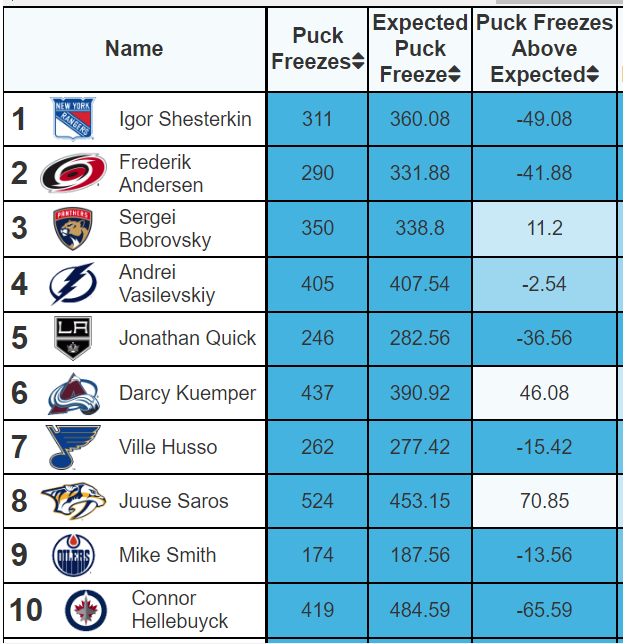
Do we have other examples? Luckily, Moneypuck.com offers a “Freeze” stats for the NHL, given it is very simple to identify them (save + whistle = kill). If we look at the best goalies in the league last season (in goals saved per 60 minutes), only 3 players in the top 10 had a positive Puck Freezes rate. Shesterkin was expected to freeze 360 pucks, based on the quality of the shots he faced, but only froze 311. And Vasilevskiy was only right on par.
So what do we do with Kills and Controlled Saves?
It tells a story, about how a goaltender is playing. How he stops pucks. What’s his style in different situations. How he is managing a first shot and seconds chances. It is a very valuable information for a goaltending coach to improve his own players, and for scouting opponents.
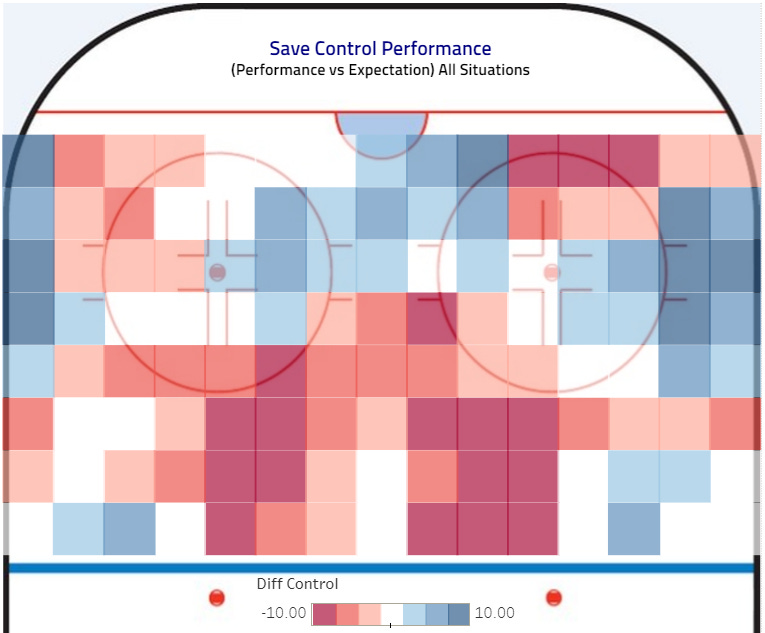
Comparing expected Controlled save% and actual performance in a heatmap shows us where the trouble can come from: shots from the high slot and center point in the example below. But we also learn that this guy is strong inside the lower slot and on the high-danger area.
Is he good overall? That’s another question, assembling multiple information among which Kills and controlled saves are just part of the story.
And consider supporting us with a coffee !

You can also follow me on Twitter pages here and NL ice Data here