Original article from December 2022.
Hi,
I wanted to email this one once again, as hockey season is around the corner and a handful of people have been asking me the same questions in recent months :
HOW DO I START TRACKING HOCKEY GAMES ?
A lot is right below.
I would add that, unless you are into a league that is NOT the NHL, you should maybe focus on specific aspects of the games, something that is not yet done by other people. Or not done enough.
Like, power-play passing systems tracking where passes start and end. Power-play set systems: Where the puck gets inside the offensive zone and how the team get into a set position. Same from an offensive zone faceoff.
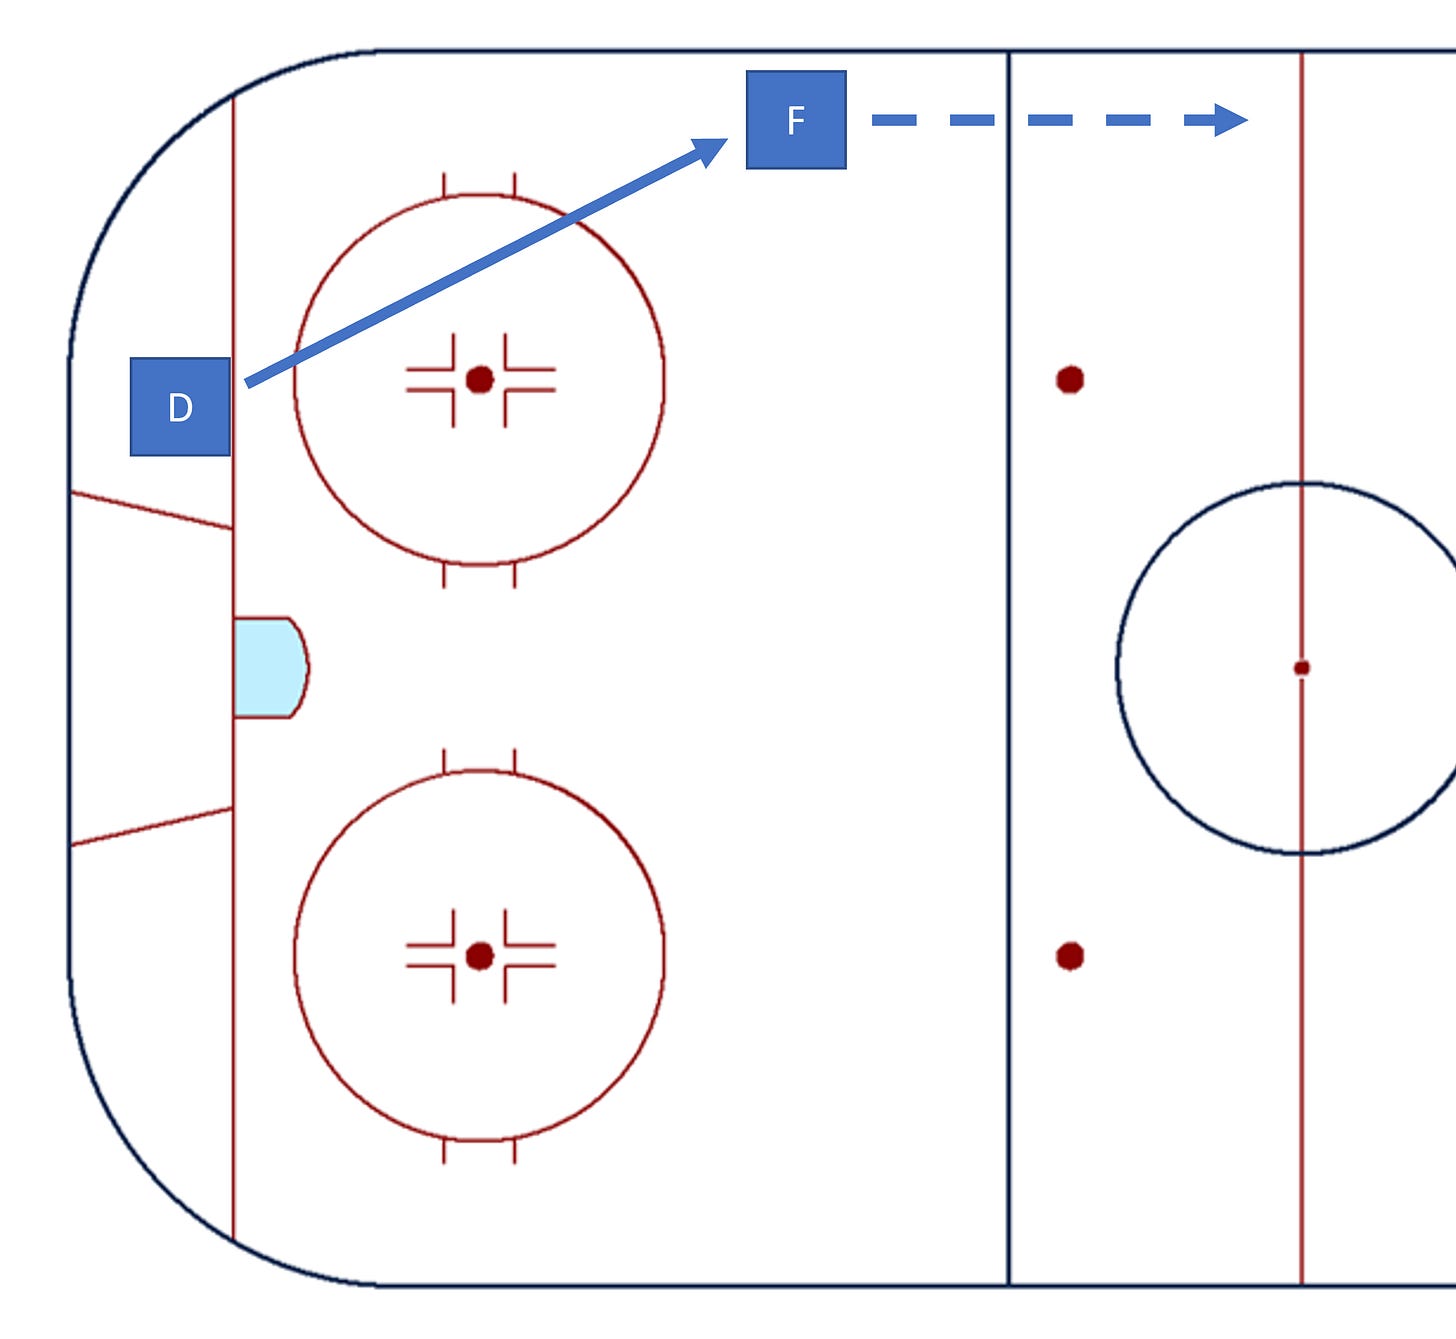
Transitions. Tracking how teams go from their defensive zone to offensive zone, are they exiting/entering on the left, center of right sides of the ice (with results or not).
Defensive coverage. Where are the two defensemen on the ice when a team allows a shot.
You know. Get crazy. Do something original. It will give you exposure (if the job is well done of course).
Enjoy.
Original article from December 2022.
Since starting this newsletter, several people have DMed me on how to start tracking games. Coaches for their teams, analysts for their own fun, etc.
So I swore I would write this article at some point, and here we are.
To track a hockey game, you only need a pen and some paper. That’s right. It might not be the most efficient tracking tool but that’s how I started myself. Because, the truth is, tracking is only counting events.
So either you are drawing bars on paper or filling up an excel sheet, you are counting things happening on the ice. You are recording events, it is a transcript of what happened.
Here’s how you could read a tracked game afterward: there’s a successful pass exit from number 7 through center ice. Then a successful controlled entry from number 26 from the right side, facing defenseman number 5. Then a shot from number 51, assisted by 26, with a screen, from location x/y. It was saved by the goalie. Puck retrieved by number 14 from the other team, etc.
There’s literally no limit to what you can track. I often joke about adding a variable for when players have long hairs or not… As long as you can count or observe it, you can track it.
Warnings and some advices
Here comes the scary part. As you can track anything you want, it can become very time consuming. And hockey teams play a lot of games. So it can turn into a burden very fast. Know to focus on the essential stuff. Events that matter in order to understand why teams are winning or losing games. Or why players have certain skills or not.
There are on average 100-120 shot attempts per 60 minutes. Easy.
There are about 160 zone exits at 5v5 per game (both teams combined). Easy.
There are about 120 zone entries at 5v5 per game (both teams combined). Easy.
But just all of those mean recording something every 10 seconds or so. With several information for each event.
Just imagine getting into passes, puck retrievals, etc. Know your limits. Tracking a game should be fun, you are watching hockey and learning stuff. If it gets tiring, it’s a sign you might want to reconsider part of your enterprise.
To give you an idea, At NLIceData, we are able to collect around 700 events per game, so the multi variables per events I will mention later in this post. It takes us 3 hours per game after years of experience. Start small then grow your project.
This is the place to give a special stick tap to Corey Sznajder, the master of hand tracking for the NHL through his All Three Zones project, through which he tracked over 3,000 games already. Unbelievable.
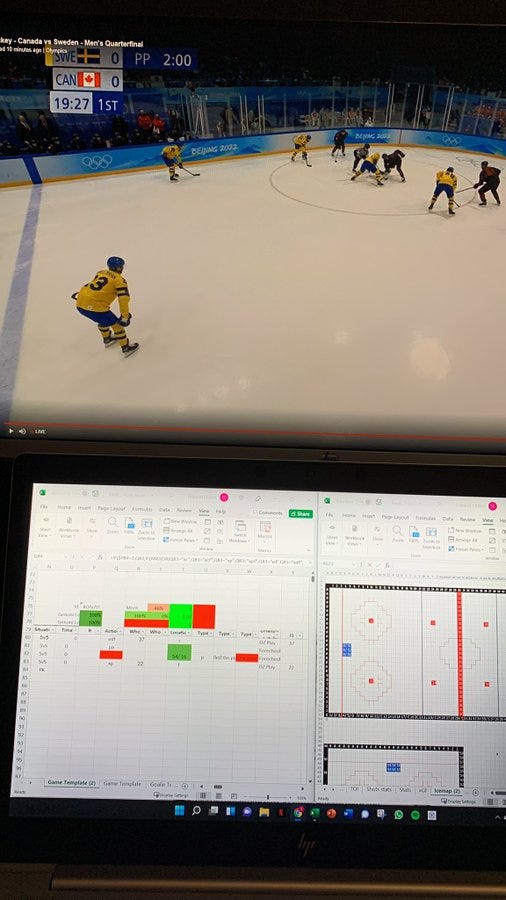
One word on the setup. If you are home, try to find a comfy position that can be sustainable for many hours. The obvious thing is to use two screens, one for the video, one for your tracking tool. I prefer one above the other, like below, to avoid any turning neck issue.
Another advice is to find the best video player available. If you have access to one of the big video providers, use their platform, they usually have built-in keyboard shortcuts for stopping, playing back or move forward, which is CRUCIAL for tracking a game.
If you can download games on your computer, use a video player like VLC where you can set up the keyboard shortcuts as you wish. You can also define how many seconds or milliseconds you wish to go back or move forward every time you press a key. One second is ideal because a lot can happen in one second and a couple of presses will bring you back where the event started.
Some online video players, like YouTube for the international competitions will bring you back 5 or 10 seconds. Believe me it’s a LOT, because you’ll have to rewatch unwanted seconds times one hundred, two hundred over a game? It adds up pretty quickly. If the player forces you to use your mouse to go back and forth, run away.
The basic stuff
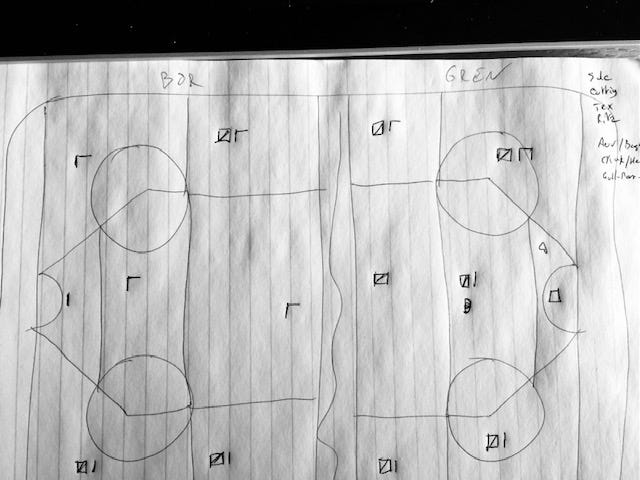
When I started Magnus Corsi in France, I had to figure out a way to track stats over couple of days. So, yes I drew a rink on paper and counted shots by zone. Using different colors of pen to differentiate 5v5 from PP, PK, etc.
On another page, I was making a bar for every exit, entry, etc.
It worked but the data was not really usable afterward, unless you enter the final numbers into an excel file or such. But, hey, if you are just looking to count shots for a minor league with no further ambition, it gets the job done. Especially if you are in the stands watching live.
Also, without a proper way to place the exact location of shots on the ice, I used zones for a couple of years in France. As a team of volunteers was helping us tracking every games in the league, it was also a way to ensure anybody (literally one person over the years found it too hard to do) could track games.
I still recommend these zones today, with a few tweaks possible if you look at similar maps from Sportlogiq or such that extend zone 1 a bit. You also can even use xG value per zone to get a rough estimate of shots quality.
Getting serious
Alyssa Longmuir wrote an article on how she was covering the Australian hockey league just making crosses on paper then properly turning everything digital using a shot plotter, which is the next step here.
If you are looking to digitalize tracking or directly use a free tool to track, you can use the awesome Shot-plotter designed by An Nguyen.
Basically you can enter events (Shots or more) one by one, locating them on the ice and adding info about the event using her customize setup option. Then export the data. Really, it’s all you need if you still want the basic stuff and a little more in a cleaner way than pen and paper.
Getting Very serious
It only gets very serious if you want to customize your tracking tool for a specific use, namely data analysis. Because the decisive moment happens AFTER the tracking, once it is time to analyse the data.
It is then that you will realize the need to track your games in an orderly fashion, with certain rules very easy to implement but vital for your database.
The first one is to identify your data, meaning every event recorded should belong to something: a game, a period, etc. So you can aggregate that event with similar events.
Also, if you are tracking things other than obvious stuff like shots, think ahead about how you define every versions of that event. Example: On a zone exit, the defenseman recovers the puck and makes a pass to a forward along the board, allowing the forward to easily skate past the blue line.
Who do you give the benefit of the exit? Technically, the forward is the one crossing the blue line. But the defenseman made the hard job. I will personally always reward the player the most responsible, here the defenseman.
Thinking about your definition ahead will avoid starting tracking things then change your method, making the data you tracked before irrelevant. Who’s responsible? How far does the player have to go to consider an exit or an entry successful? What’s a dump and what’s a pass in an open space? Etc.
Let’s imagine we are using excel to track, just because that’s what I do and everybody can imagine an excel sheet.
Just get columns for: Season (duh), a Game ID, Home team, Away Team, Event number (1 to infinity). The best thing is you will never have to touch those during your tracking.
Next, have a column for the Period, to change 2 times a game, a column with the minute of the event if you want, the situation (5v5, PP, etc.) that you will only change when needed.
Then the tracking columns per say. The ones you will put info into on most of the events. In my tool, there are only seven of them, in the red square below.
(Pause to mention you can leave space to enter your rosters or compute a quick ongoing statistically resume of the game like I do at the top of my sheet).
Action: for the code describing the event. Use simple codes, easy to remember. There’s only one rule: no more than 4 letters… because you have 4 fingers (and a thumb).
In mine, all exits start with “x”. “xc” is a successful carry exit, “xp” is a successful pass exit, add an “f” and any event becomes a fail. “xcf” is a failed carry exit, etc. Add an “a” and the event is for the other team (xca, xcfa, etc.), so I don’t have to specify which team has the puck, the tool will identify it automatically. Cf/ca are shots gf/ga goals, cfs/cas screened shots. Entries are ec/ed/eca/edfa, etc. See the logic?
Who and Who 2 are to enter the jersey number of the player(s) involved. Who is always the player with the puck, and Who 2 would be the defending player on a battle/zone denial/turnover, or the teammate making the shot assist.
I use Location for shots, with my “1 cell = 1 square meter of ice” map I built on the right. I also just put codes “l/c/r” for left, center, right, on any transitions.
Context and SC Type are used to describe shots and Scoring chances in particular. “r” is rush shot, “b” is rebound, “rb” is a rebound off the rush, “p” is from a high-danger pass, etc. One letter is enough most of the time. Overall, you get the idea that could have a couple of extra variables to add some depth to your tracking.
Save Type would describe is the goalie makes a controlled save, uncontrolled save, kills it or allows the goal. For this you can have dropdown lists at your ready if you want to avoid the risk of spelling mistakes.
And that’s it! (for me). The tracking tool has close to 100 columns, but besides those 7, they all compute themselves based on what codes I enter. Like identify the attacking and the defending teams based on the Action codes, so in what zone the puck is. Following the succession of codes, I also group sequences together, from the moment a team gets the puck to the moment the other team records an event with the puck.
I properly describe the event tracked as well, with different level of granularity, identifying Exits together, then Controlled Exits together, then successful or failed events, get the player’s name from the number I entered using a separate roster sheet, etc. But all of that can be done afterward as well if you’re using R or Python, etc.
But coming back to rule #1, make sure your events are recorded in a way you will be able to aggregate them, cross reference them any way you want.
That’s it. I think.
Then store your data somewhere with a back up and start having fun going through it. Which would be another article, really.
If you have any questions, just dm me on Twitter!
And consider supporting us with a coffee !
You can also follow me on Twitter pages here and NL ice Data here


