Projecting Prospects of any league and age
Hi there, here’s the final article on our Prospects model.
Which is NOT the Draft model. As it doesn’t limit itself to NHL Draft eligible players but include any hockey player in the world (almost) from 16 to 22 years old. And we do not ask of it to pick players at a very precise moment in time, but rather to continually measure their growth over several years.
With one thing in mind: assessing potential.
Projecting prospects is hard (thanks Captain obvious). It is especially tricky if you have to cover multiple leagues, with players from different ages, positions, at the same time.
For a while now, models have been built to project draft eligible players and follow their development afterward. We, ourselves, brought our piece to the story with our NHL Draft model based not only on points but also on Win Shares.
2023 NHL DRAFTe model
Last year we introduced our DRAFTe model, aiming, like many of our stats colleagues, at giving a ranking ahead of the NHL Draft. Now, everything can be perfected, right? To be brief, we wanted to not limit ourselves to drafted players, but to use all draft eligible players since 2008. That way, we were not introducing a bias only looking at players deemed…
Now, the NHL might be the best league in the world and represents the ultimate goal for every player, but there’s a whole world out there, both for players, but also team managers handling hundreds of teams across dozens of professional leagues.
Them too, have to develop and sign players, assess potentials and steal underrated prospects. That is why we wanted to build a model tailored to everyone’s needs.
Components
A lot of this is similar to the Draft model, for obvious reasons, philosophically speaking in our approach and to remain as constant as possible across models. What was right for one is often right for the other.
As always, we only considered players with at least 10 games in a given league.
Only regular season stats are included. No playoffs, no international tournaments.
A prospect is a player from his 16 years old to his 22 years old seasons. The reference date is July 1st, so a player is on his 21 years old season in 2022-23 if he turned 21 before July 1st 2023. Which also means players born in July, August and early September are considered one year younger than their NHL Draft group, like Miro Heisaknen would have been for instance.
Careers are considered up to 30 years old, avoiding all the noise in the data as older players have much more ups and downs.
All leagues were translated into NHLe values, using our newly reworked NHLe we presented recently. By doing so, all players are already becoming apples to apples, even the ones going through different leagues (like Matvei Michkov playing in MHL, VHL and KHL).
One difference with the NHL draft model is the inclusion of three seasons of data if we can, instead of two. Using our world database, we established the value of every player at a moment in time using the following split:
year0 = 60%, year -1 = 25% year -2 = 15%
year0 = 66% and year -1 = 34% if there’s no data for year -2
year0 = 75% and year-2 = 25% if there’s no data for year -1
With those weights, we calculated a player’s ongoing value both on Win Shares and Points in parallel. While we wanted to keep using Win Shares as a better proxy for the overall impact of players, points production remains strongly correlated with present and future performances, probably because hockey is a sport where the better players simply score more, no matter the position they play. Especially at a younger age.
If a player has played in two or more leagues the same year, they are weighted based on the number of games they played there. Like Matvei Michkov’s 30 games in KHL weight for 71% of his draft year season, compared to 29% for his 12 VHL games.
Methodology
We went back and look at the performances of any player in any league per season in order to see what he had become later. Aggregating all those case studies (312,000 of them), we were able to measure for instance what a high performing 17 years old defenseman in the Swedish second league (Allsvenskan) became on average for the rest of his career, as long as they played at least another 200 games after that season.
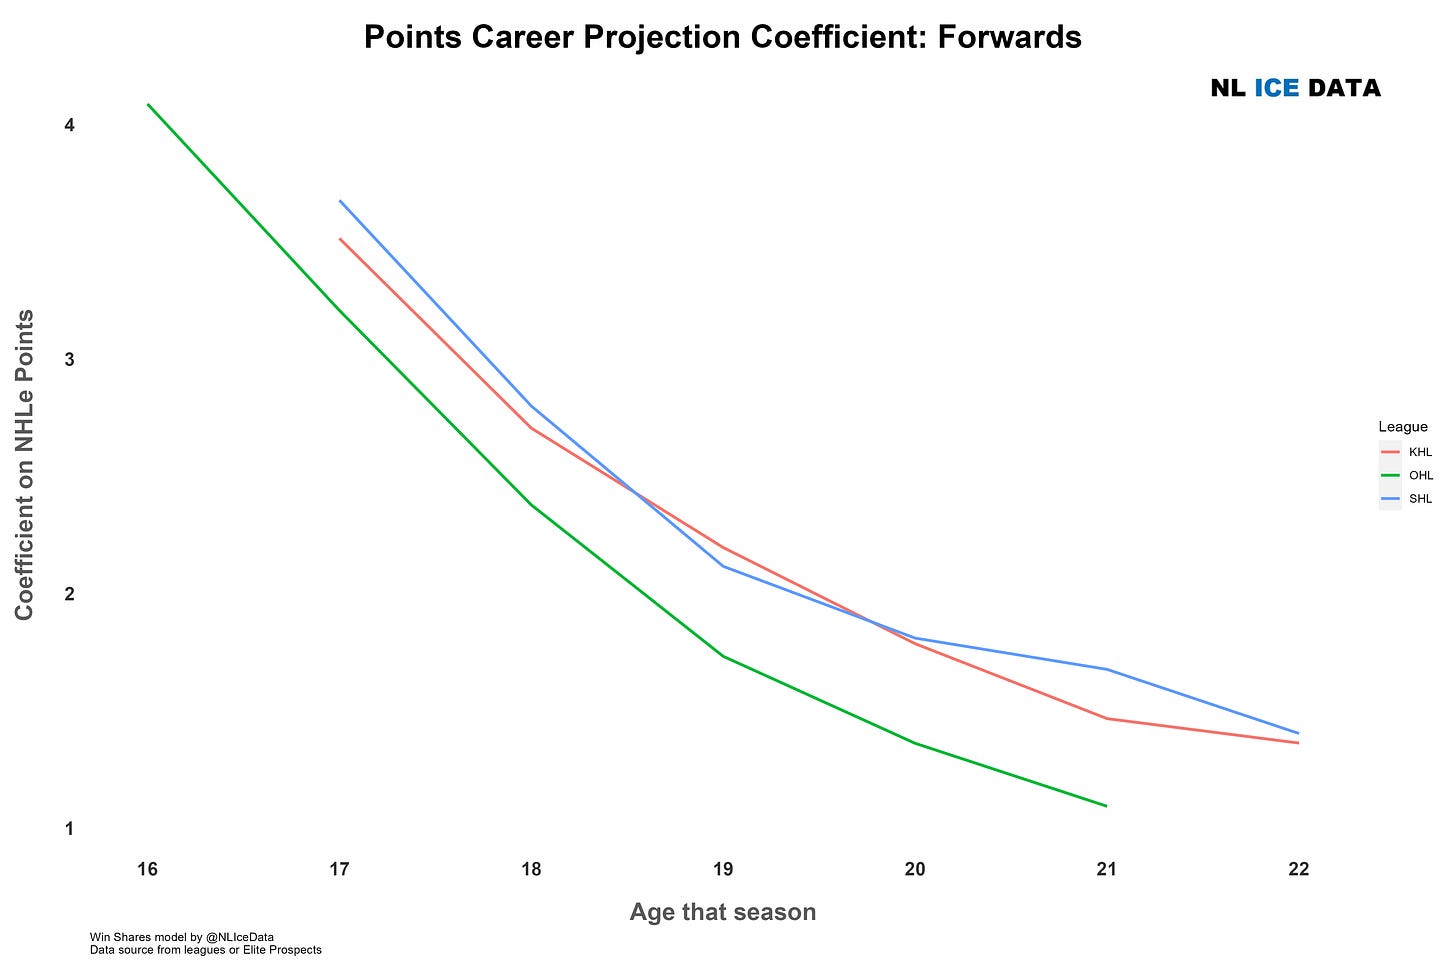
Therefore, we calculated a career projection coefficient for every group of age playing in every league. For example, 81 forwards were in the OHL at 16 years old and their NHLe points were multiplied on average by 4.1 to get their seasonal career average till they were 30 years old.
That coefficient goes down as you get older, simply because your performances improve and get closer to what your professional numbers will be.
If we compare junior and senior leagues, we can see that playing in senior leagues like the SHL or KHL lead to a higher coefficient, because you are obviously not scoring as much as in junior, but you also keep up a fairly positive coefficient coming 21 and 22 (around 1.4 here), when you are reaching a “what you see is what you get” coefficient of 1 in the OHL.
If we go beyond the limits of the prospect model (22 years old), the flattening of expectations if rather clear in any senior league.
To wrap it up, we established for both Points and Win Shares:
Pts NHLe Career potential = Pts ongoing value * Pts Projection coefficient
Reversing it back in local leagues
This is where projecting for the NHL differs from projecting in any other league. They key thing is that we have a very clear history of what players made the NHL, from anywhere. Based on your age, position, the league you are playing in and how good you are, your chances of becoming an NHLer are of xx%.
But for many leagues, the very best players, especially at a young age… simply never reach the local top league or do not play there for very long… because they are gone to the NHL/AHL. So any probabilities model is messed up by nature, when your best prospects have a 0% chance of playing pro (though that is information in itself).
That is why we kept the NHLe career potential, which tells us how good of a hockey player you might become, no matter where you play. It was then only a matter of reversing the projection from NHLe to local values.
It is actually simple, using the reverse NHLe coefficients (1 / NHLe). For the Swiss National League, you go from a 0.509 points NHLe to 1 / 0.509 = 1.96 reverse NHLe.
Pts NL Career potential = Pts NHLe Career potential * 1.96
Same thing for Win Shares. And we end up with a Career average potential for both points and Win Shares.
Assessing the potential career impact
The final step was to translate those Career potential numbers into tangible impacts. In order to do this, we can compare the potentials with historical performances in that targeted league.
Looking at the past 10 seasons, we defined plateaus, like when top 10% percentiles (“Elite”) forwards in the SHL scored 32 NHLe points per season. Top20% (top line) scored 26, top 40% (“Second line”) scored 19, etc.
We measured the Career potential of a player both on Points and Win Shares and looked at the overall distribution, measuring how much you exceed or are below each plateau. And we gave a bit more weight to the points projection as it seemed to determine your future career a bit better than Win Shares.
Ranking prospects
The end result if a ranking of prospects, that we can filter by country of origin, or current leagues, and see who has the highest projection for points, Win Shares, and role.
One big digression here. We are working here with potential, which is different from “upside”. Upside is a wish. It is the best case scenario where everything in a prospect unlocks, he’s given time and opportunity, avoids injuries, etc. How many prospects are qualified as “could become a top pair/line” before the draft, but how many really become that? Average potential is what you can expect along the long term, with ups and downs along the way. It is much more telling if you are a manager planning and building with as much certainty as possible.
That is why we decided to establish rankings based on the the highest role you can achieve.
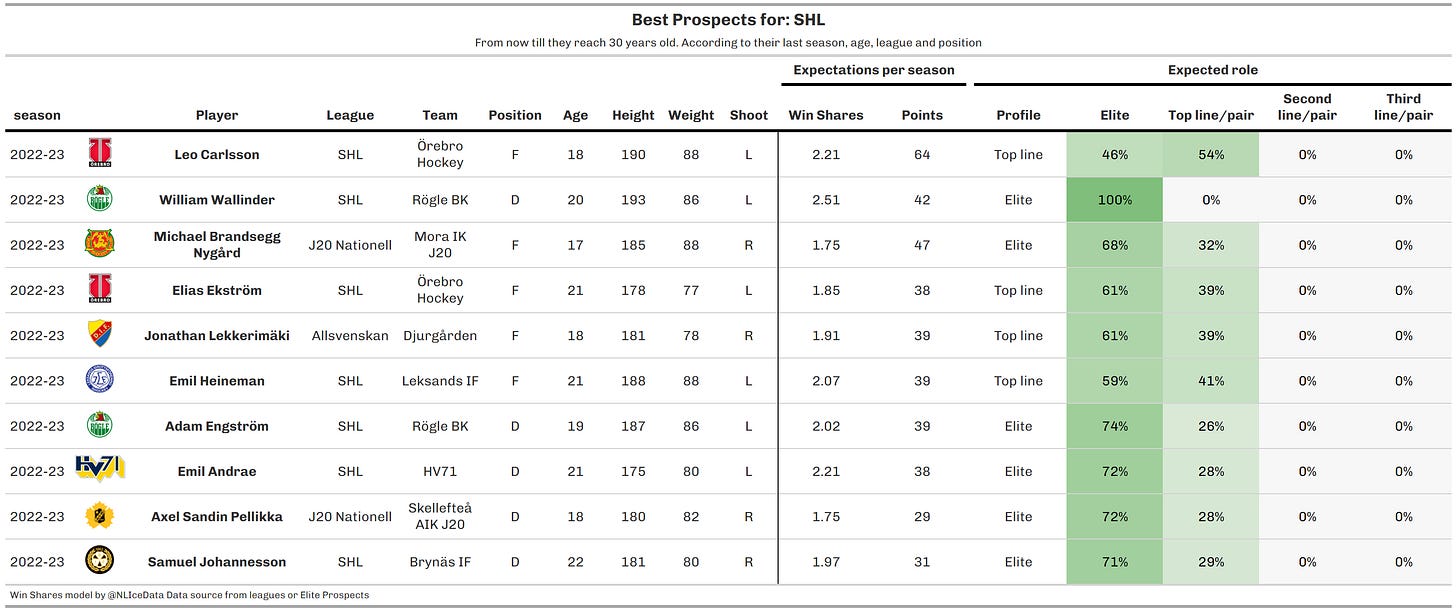
Looking at players currently in any Swedish league, Leo Carlsson gets the highest expected profile, even though he is only 18 years old, but his pedigree is one of a kind. His projected production of 64 points per season is actually too good for the SHL.
But most of the other players here are older, having proved year after year they kept on getting better. To remain on top of such a model, a prospect has to improve every season, because the expectations become harder to meet as you get older and play in better leagues. In brief, it is easy to be a star in your junior league. It is something else to be a star among pros. Basically, the older you get, the best performances you need to put up to remain a top prospects because you are no longer being projected in the big leagues, you are playing in it.
Like how Adam Engström improved this season after an already interesting U20 year.
Or like Elias Ekström, an undersized undrafted 21 year old that kept on improving and could be a nice SHL players for years to come.
Axel Sandin Pelikka shows up there, as a top 2023 prospect, and so is Jonathan Lekkerimäki, still in his 18 years old season, being born in July. The final use of the model could be to find potential gems, like Michael Brandsegg-Nygård. The 17 years old Norwegian is already 6’1, 194 lbs and ranked third here after putting a point per game performance in his first year in Swedish U20. But, we only have one year of data on him, so put him on a watch list.


