What are Win Shares?
Assessing a player's contribution in any league

The hockey world revolves around points, goals and assists, because they are easy to quantify. And the truth is, good players score points, so the correlation between your scoring, as a junior or as an older player, and your chances of playing in the best leagues is high.
But points are also a cumulative stat, that doesn’t tell you about the collective context you are playing in. Basically are you dragging a poor team on your back or playing on Connor McDavid’s wing? And, sure, there is the +/-, but if you are playing in a good team, you will surely have a high +/-, and vice-versa… Not really useful.
In the end, we know there is more than points in bringing success to your team, especially for certain types of players with a more defensive task. But we don’t know how to measure it.
At least, publicly.
Coming from baseball, there are now broader metrics used to evaluate a player, in terms of how many wins or goals he/she is bringing to his/her team, based on his/her impact on scoring, puck possession, penalty differential, special team impact, etc. Sadly, “WAR” (Wins above Replacement), “GAR” (Goals above Replacement) and other metrics only exist for the NHL, or through private providers on other leagues.
We wanted to find a remedy to that black hole in public data.
Enter Win Shares
Win Shares are based on the Point Shares formula detailed on Hockey Reference (basically 3 points is 1 Win) and calculate how many wins a player is bringing to his team over a season, through both his offensive and defensive impacts.
Win Shares include goals and assists for the offensive input, 5v5 goals differential or the usual +/- for the defensive input if there’s nothing else available. But it does not stop there.
The good part is that both offensive and defensive performances of a player is put into perspective by his time on ice (real or estimated) and collective environment, comparing his team’s scoring and goals allowing to the league average to know if he was playing in a good or bad team. If shots on goal are also available, the team’s performance on shots against per 60 minutes is also compared to the league average.
It has been great for us highlighting well-rounded players, defensive defensemen and players surviving in a bad environment, players that would not look that good by points alone.
It is also great to search for the best players on Defensive Win Shares, or on Offensive Win Shares.
We were also able to use Win Shares to calculate translation coefficients between leagues. Like an KHL player is expected to keep 64% of his Win Shares in the NHL, versus 71% of his points.
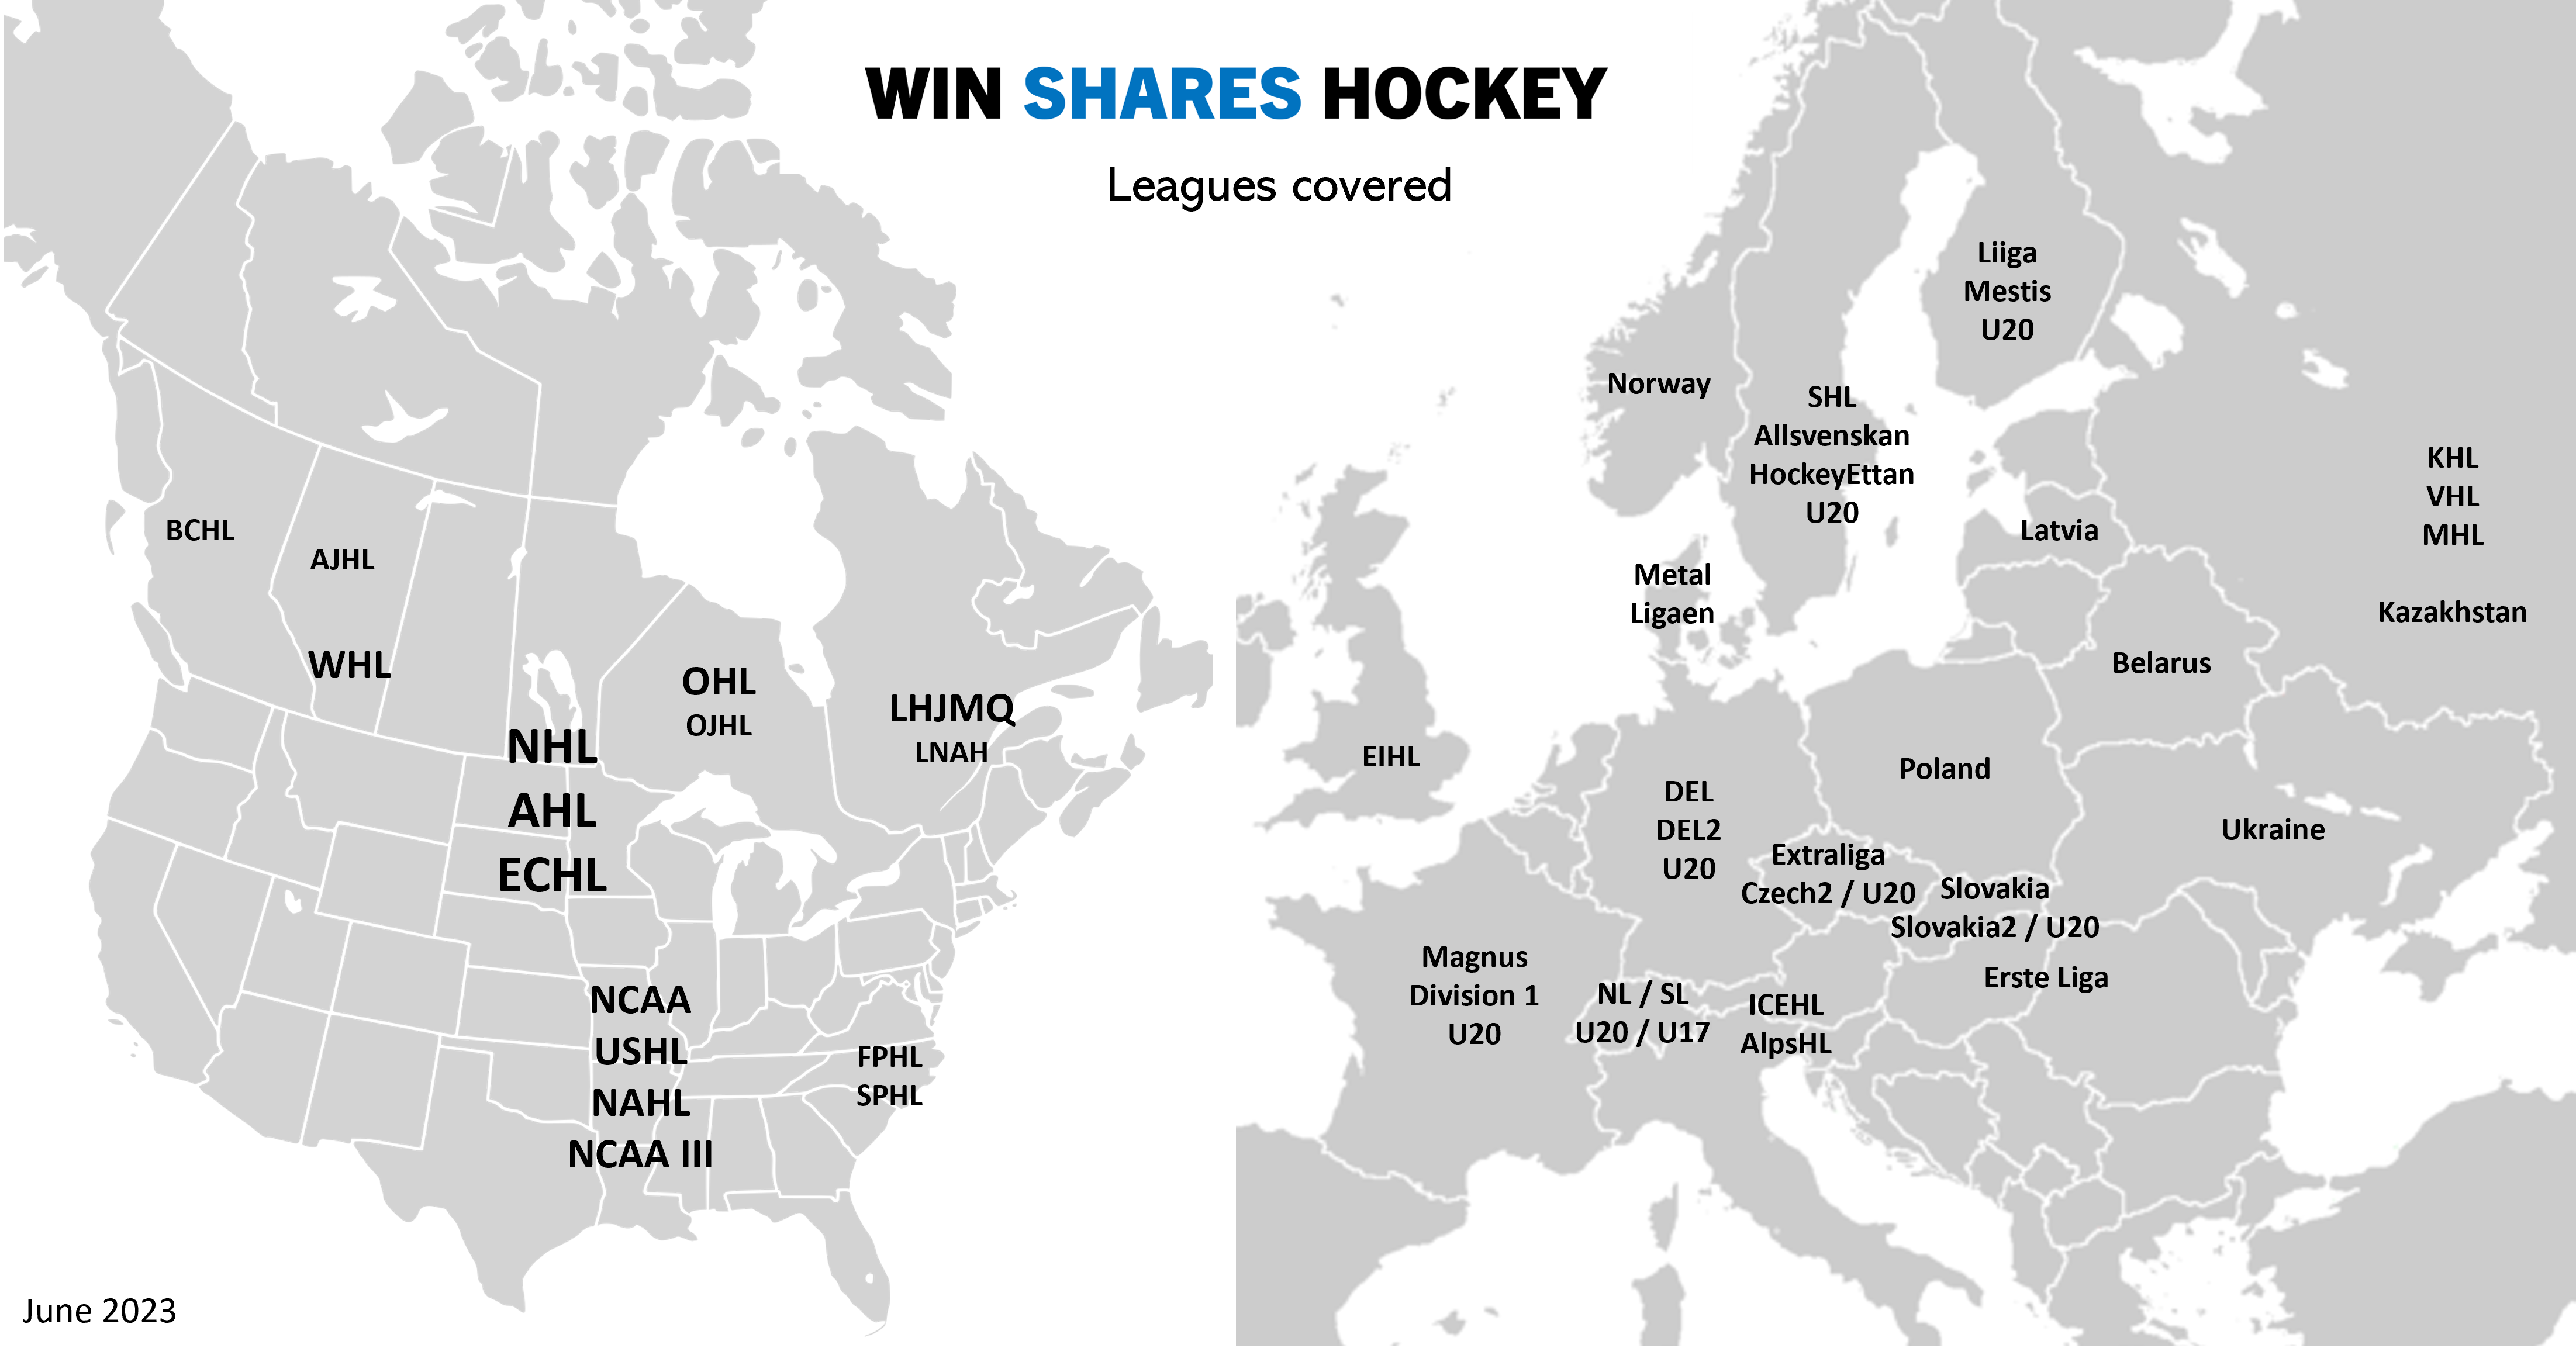
But the best aspect of Win Shares is that you can build them for almost any league in the world as long as you have the stats mentioned above, as well as the following information on teams: Games, Points, Goals For and Against, Shots For and Against if possible. It may require an exhausting hunt over the internet to find all the information between Elite Prospects, league websites and sometimes media sites but so far we always got what we needed. Let’s note that we put all leagues into a 3-2-1 points format so 3 Point Shares = 1 Win Shares for any player anywhere.
It is not as precise as WAR or GAR but it can be universally used. So far, we re-created Win Shares for above 50 leagues, going back to 2007-08 for most of them. And we will soon present them to you on a brand new website, alongside many things we can derive from that information.
Stay tuned!