

Last year we introduced a model aiming at projecting prospects of any league and any age, based on their performances, their age at the time, position played and the league they are currently playing in.
Projecting Prospects of any league and age

Hi there, here’s the final article on our Prospects model. Which is NOT the Draft model. As it doesn’t limit itself to NHL Draft eligible players but include any hockey player in the world (almost) from 16 to 22 years old. And we do not ask of it to pick players at a very precise moment in time, but rather to continually measure their growth over severa…
You can use it for the NHL (more on that later) but also for assessing the potential of any player from 16 to 22 years old in any league. Namely, you are a Swedish GM and want to look at all players under 22 playing in Swedish junior, Allsvenskan or SHL, you can do it.
Now, we are late to the game, but as the off-season is progressing, we finally found the time to revisit the model and make some adjustments.
I’ll leave you to read last year’s article if you want full details on the original model but I’ll still recap it here in brief terms and highlights the changes made.
Components
10 games minimum in a given league. Regular season only.
A prospect is a player from 16 to 22. The reference date is July 1st.
Careers are considered up to 30 years old, avoiding all the noise in the data from older players having much more ups and downs.
All leagues were translated into NHLe values, using (ALERT NEW STUFF) our newly era-adjusted 5 years rolling NHLe we presented recently. By doing so, all players are already becoming apples to apples, even the ones going through different leagues over a season.
We use up to three seasons of data if we can (current year = 60%, year -1 = 25% year -2 = 15%).
With those weights, we calculated a player’s ongoing performance both on Win Shares and Points in parallel.
Assessing Career Potential
We grouped players per: league, age and position (for example: forwards in the OHL at 17 years old), we looked in the database for a link between their ongoing performance at the time and how they fared in their careers later on. It resulted in a coefficient for points and a delta value for Win Shares (as it can go into the negatives).
NEW STUFF: Talent adjustment: Now, to truly assess players, we added a talent adjustment, comparing a player performances to the historical average player of his group (league, age, position), on both Win Shares and Points. That talent adjustment coefficient is applied to the Career potential of the player. For instance, a top tiers MHL 18 years old forward produced 10.5 NHLe points, but recent Montreal pick produced Ivan Demidov produced 21. Being 2.03 times better than the average top tiers player from his group, Demidov received a 2.03 coefficient on his Points NHLe Career potential.
Points NHLe Career potential = Points ongoing value * Points Projection coefficient * Talent coefficient
Win Shares NHLe Career potential = WS ongoing value + WS delta projection + Talent delta
When projecting for another league than the NHL, we use those Career potentials and multiple them with our NHLe coefficients for that league.
Potential Career Role
The final step was to translate those Career potential numbers into a tangible role. In order to do this, we can compare the potentials with historical performances in that targeted league.
Based on the Career potential numbers, we calculated the probability for a player to be projected as elite/top/second, etc.
NEW STUFF: REFINING ROLE PROJECTION. We did this with the idea that teams are looking for talent, and that high-end players are worth more than the “rest”. So, looking back at the historical data, we calculated for every league how much more an elite player was worth compared to a top line guy, or a second line guy, etc. For NHL defensemen, an elite defenseman is worth 2.07 a second pairing player for example.
Using those values, we calculated a Profile score based on the probability of each role and the value of that role.
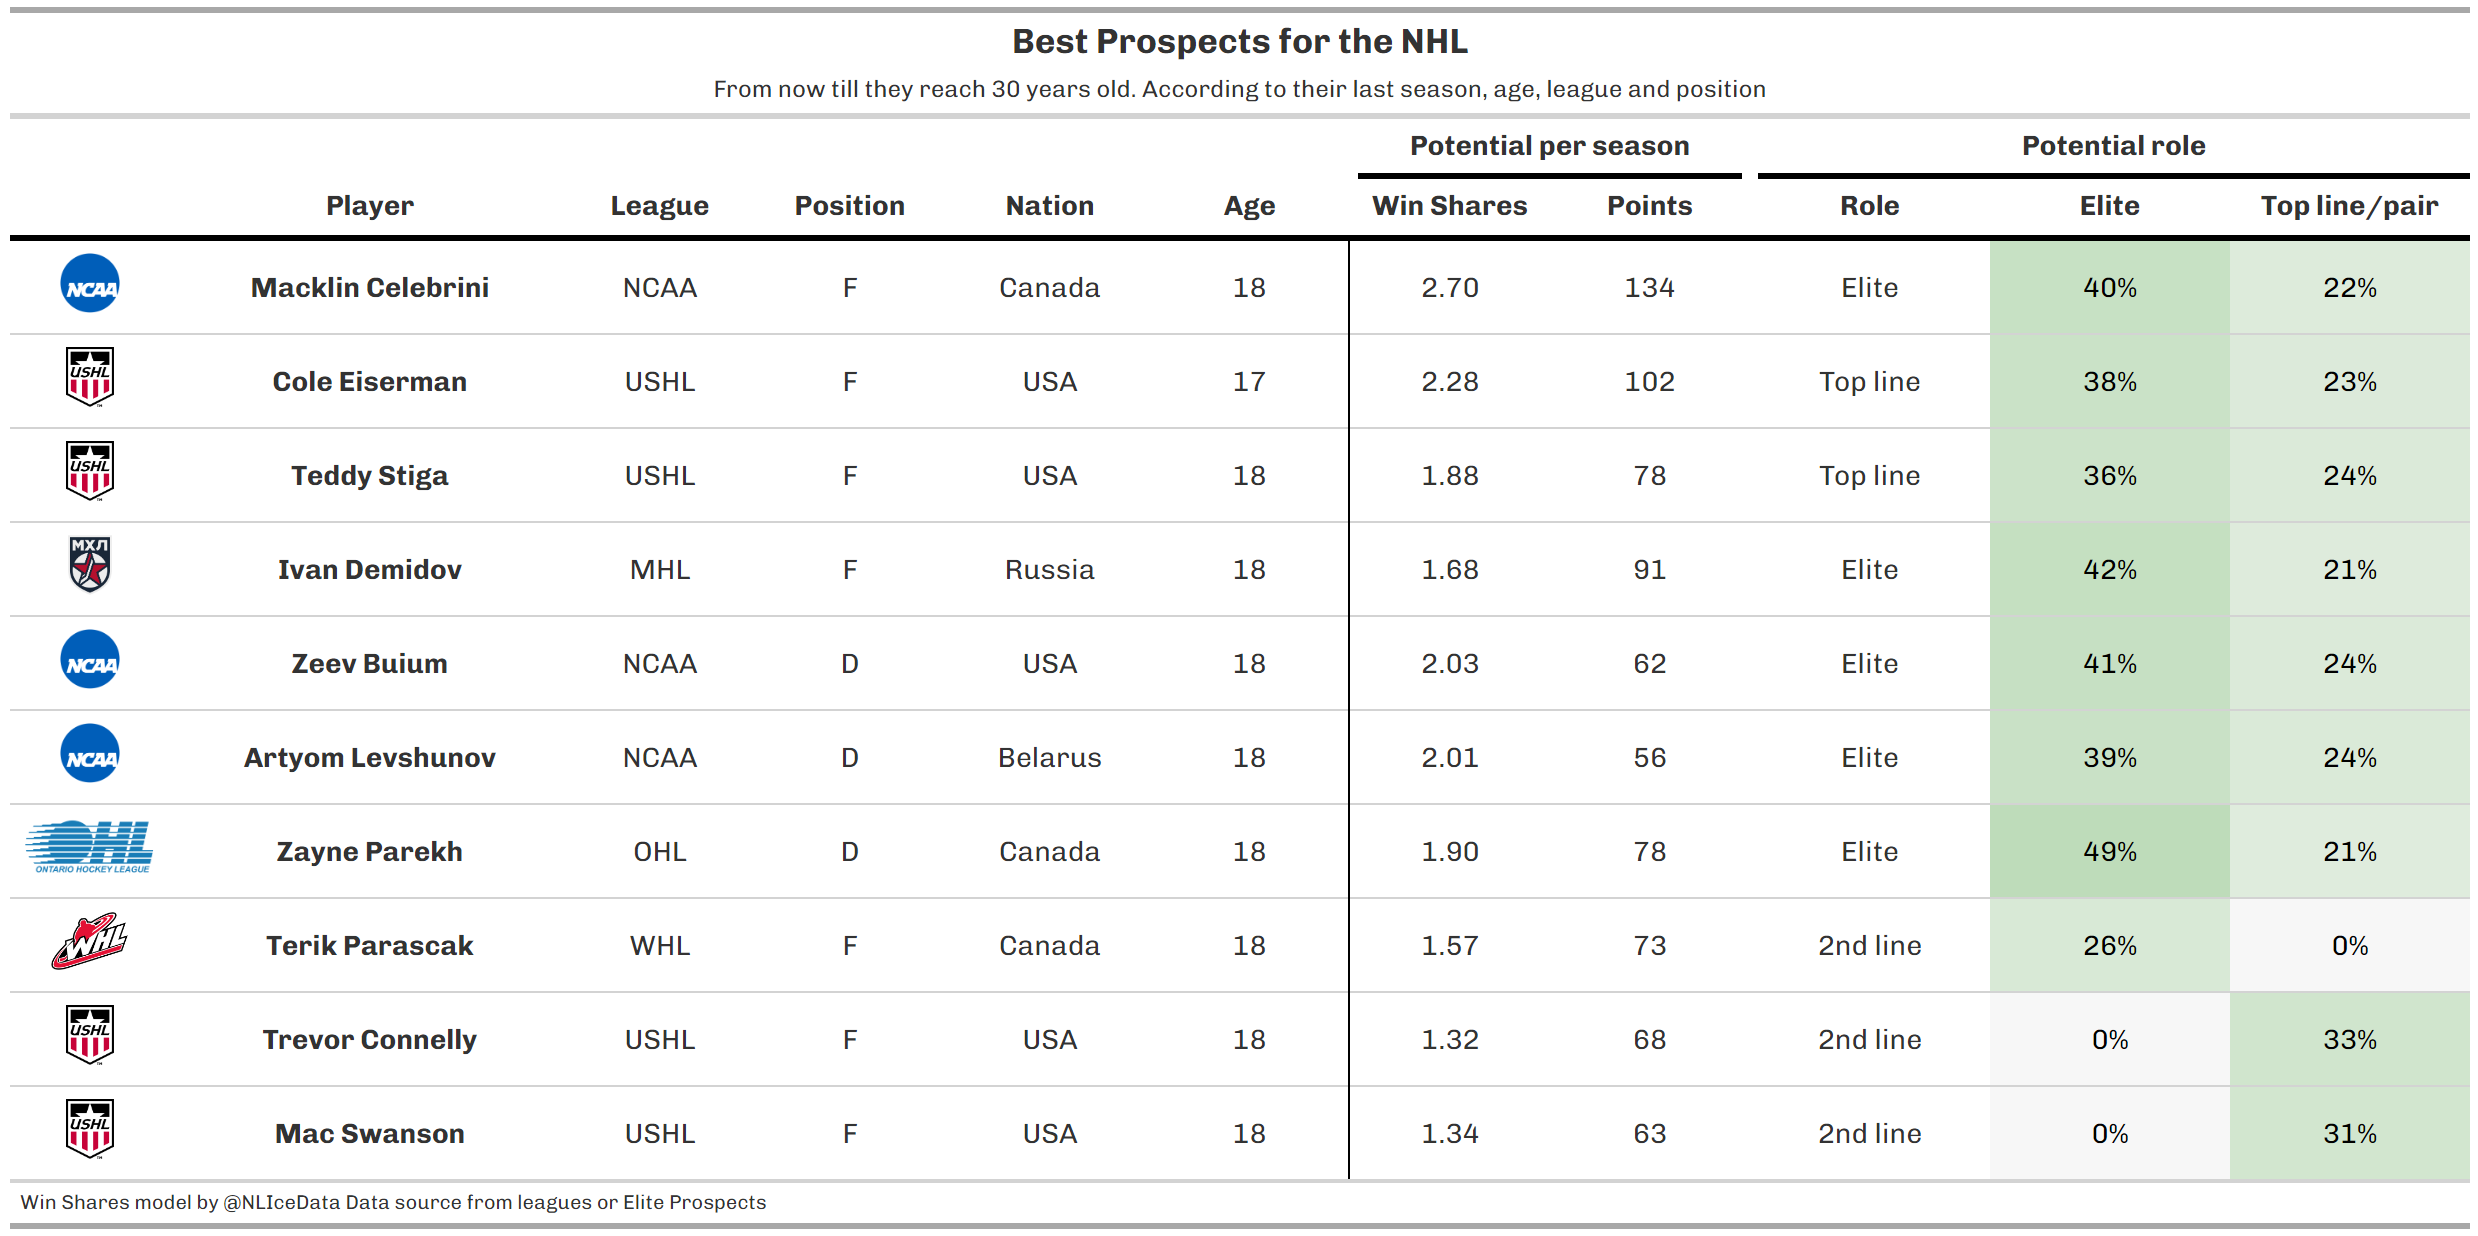
We also redefined the Role projection, not simply taking the role with the highest probability but looking at the overall distribution. A good example is Cole Eiserman whom has a 38% chance of being Elite in the NHL, 23% chance of being Top line and 39% chance of being Second line. So Second line has the highest probability but the chances of being Elite or Top line is higher, slotting him into a Top line projection which seems fairest.
Ranking Prospects
Here comes the hard part. We have Win Shares Career potential, Points Career potential, a Projected Role based on both… Which one to use? The decision was to go with Win Shares and Projected Role.
Why? Win Shares now correlates better with the future career of players, and they are largely driven by points themselves. The projected Role is also almost half driven by points. So everything is included one way or another.
To unite everything, we took the Win Shares NHLe Career potential (* 100) and added to it the Profile Score we mentioned just above.
Macklin Celebrini has a Win Shares NHLe Career potential of 269.5 + his 222 Profile Score = a 491.9 “Prospect value”. Now, we do not think this needs to be used and shown as a one go-to metric, but it is definitely useful for ranking.
So how does the 2024 NHL Draft looks like?
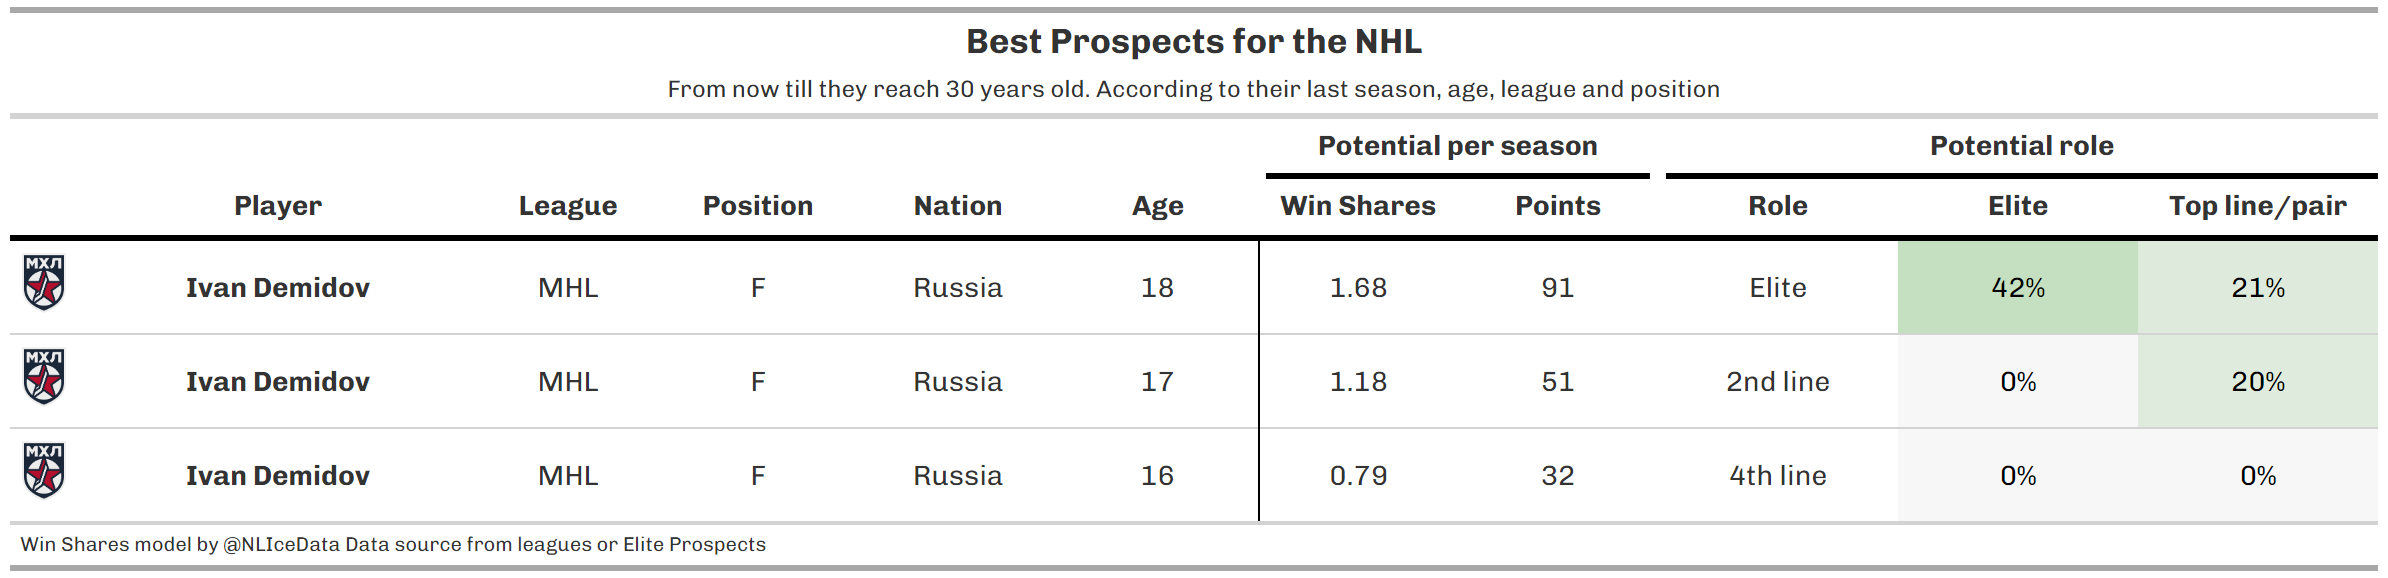
Want to check on the career of a prospect? Here’s Montreal’s Ivan Demidov through the years.
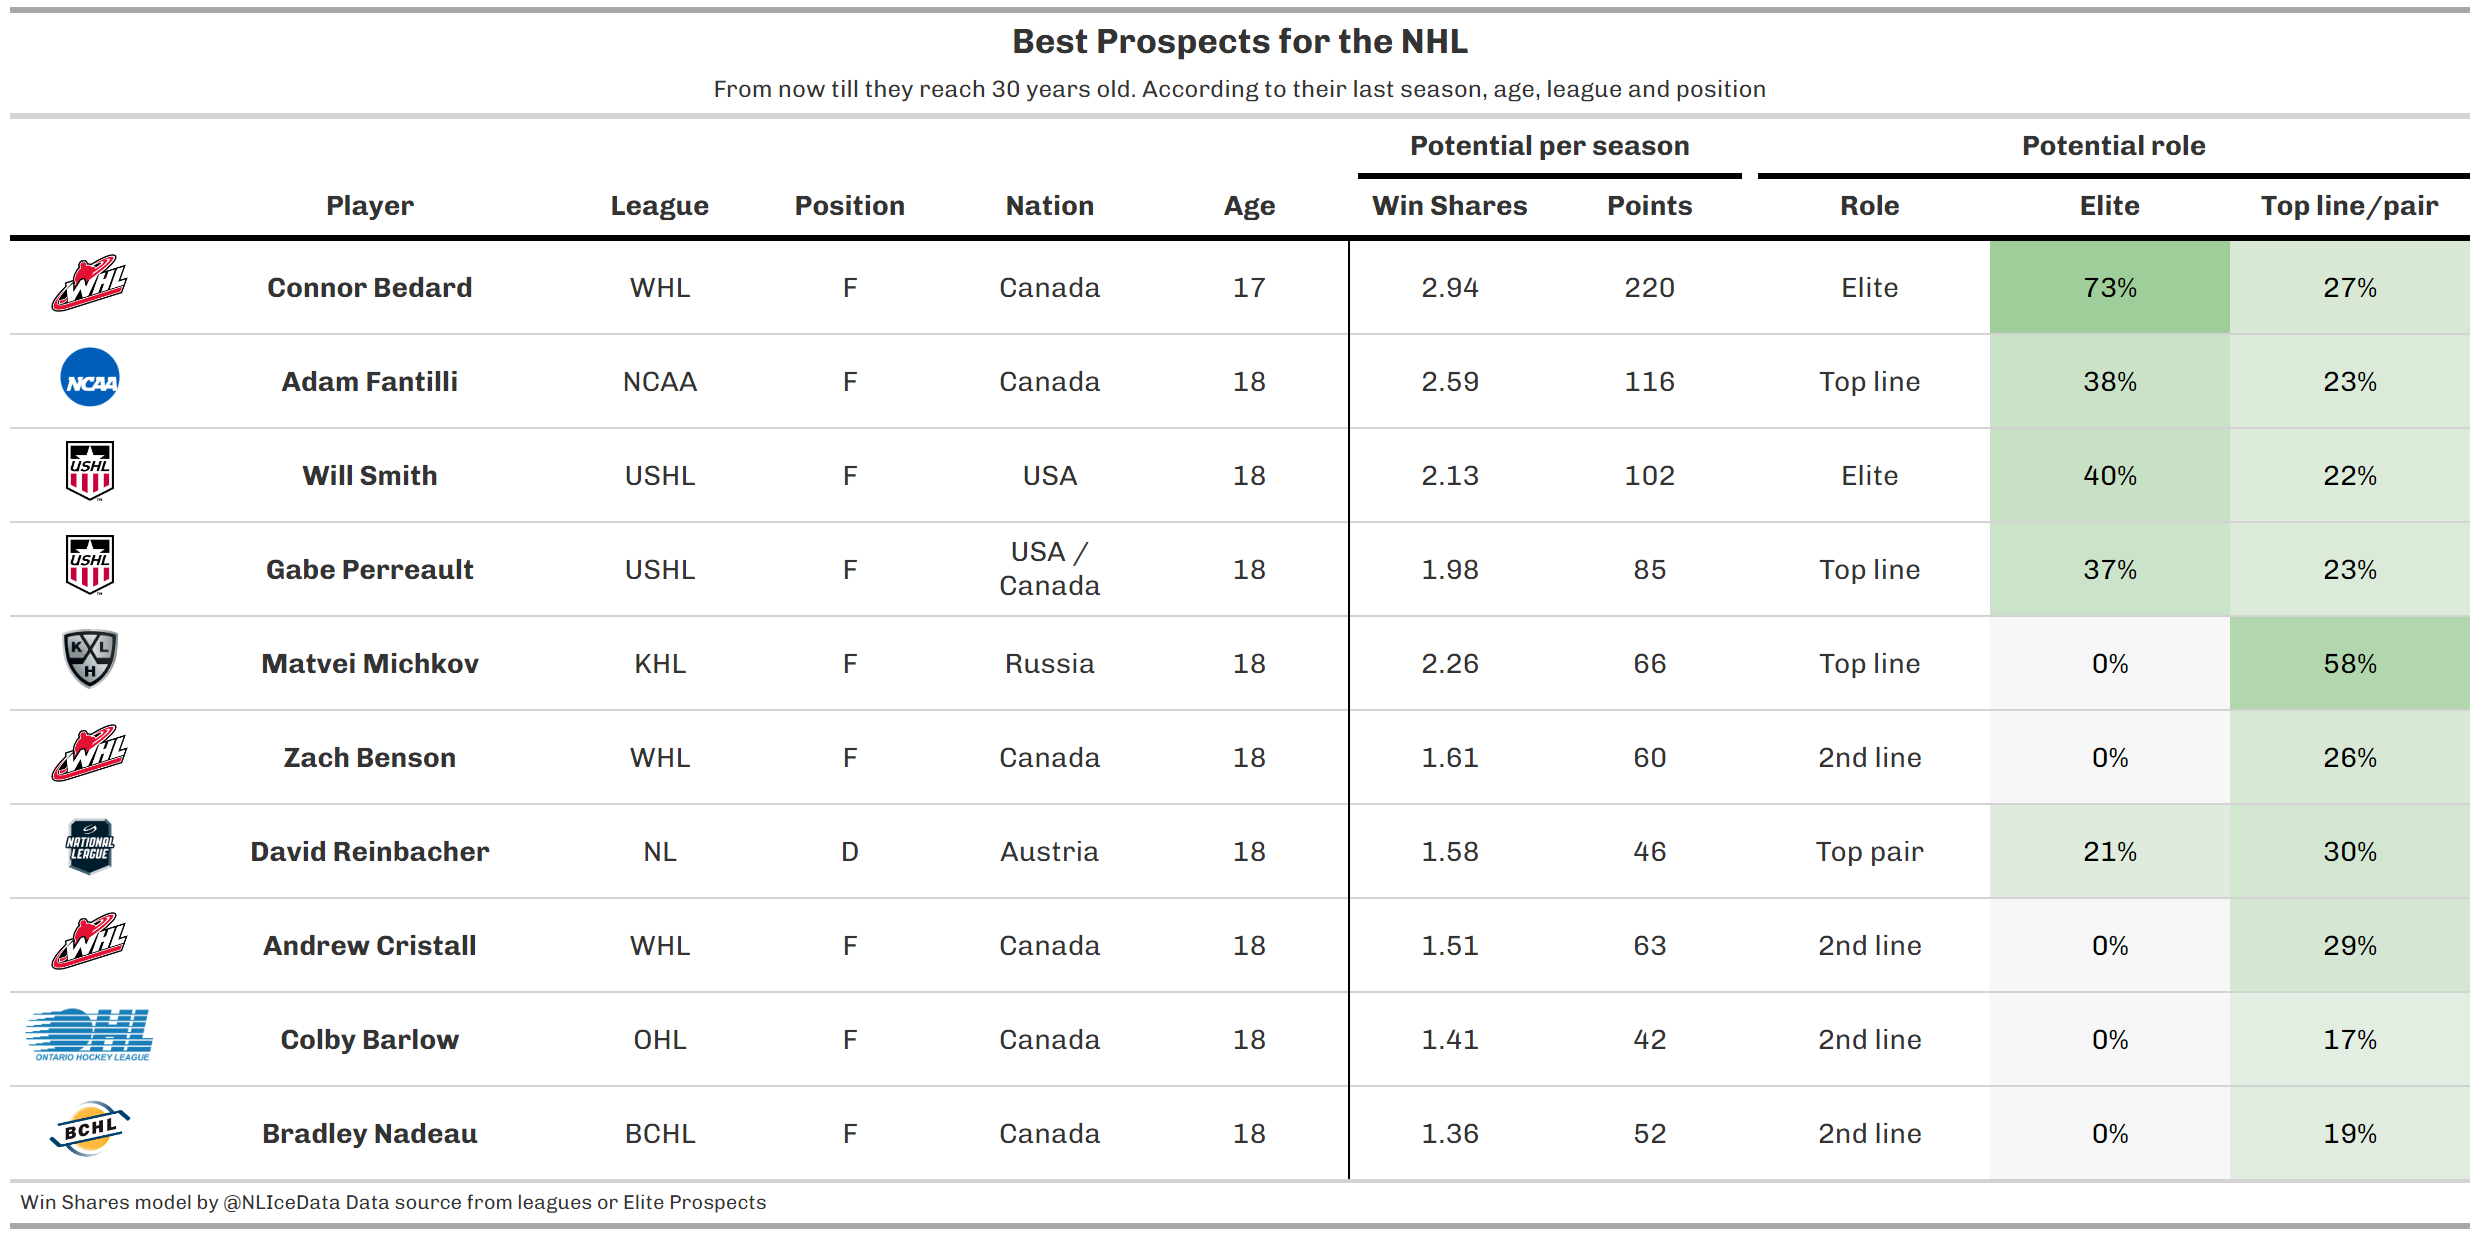
How did the 2023 Draft looked like? (absurd for Bedard)
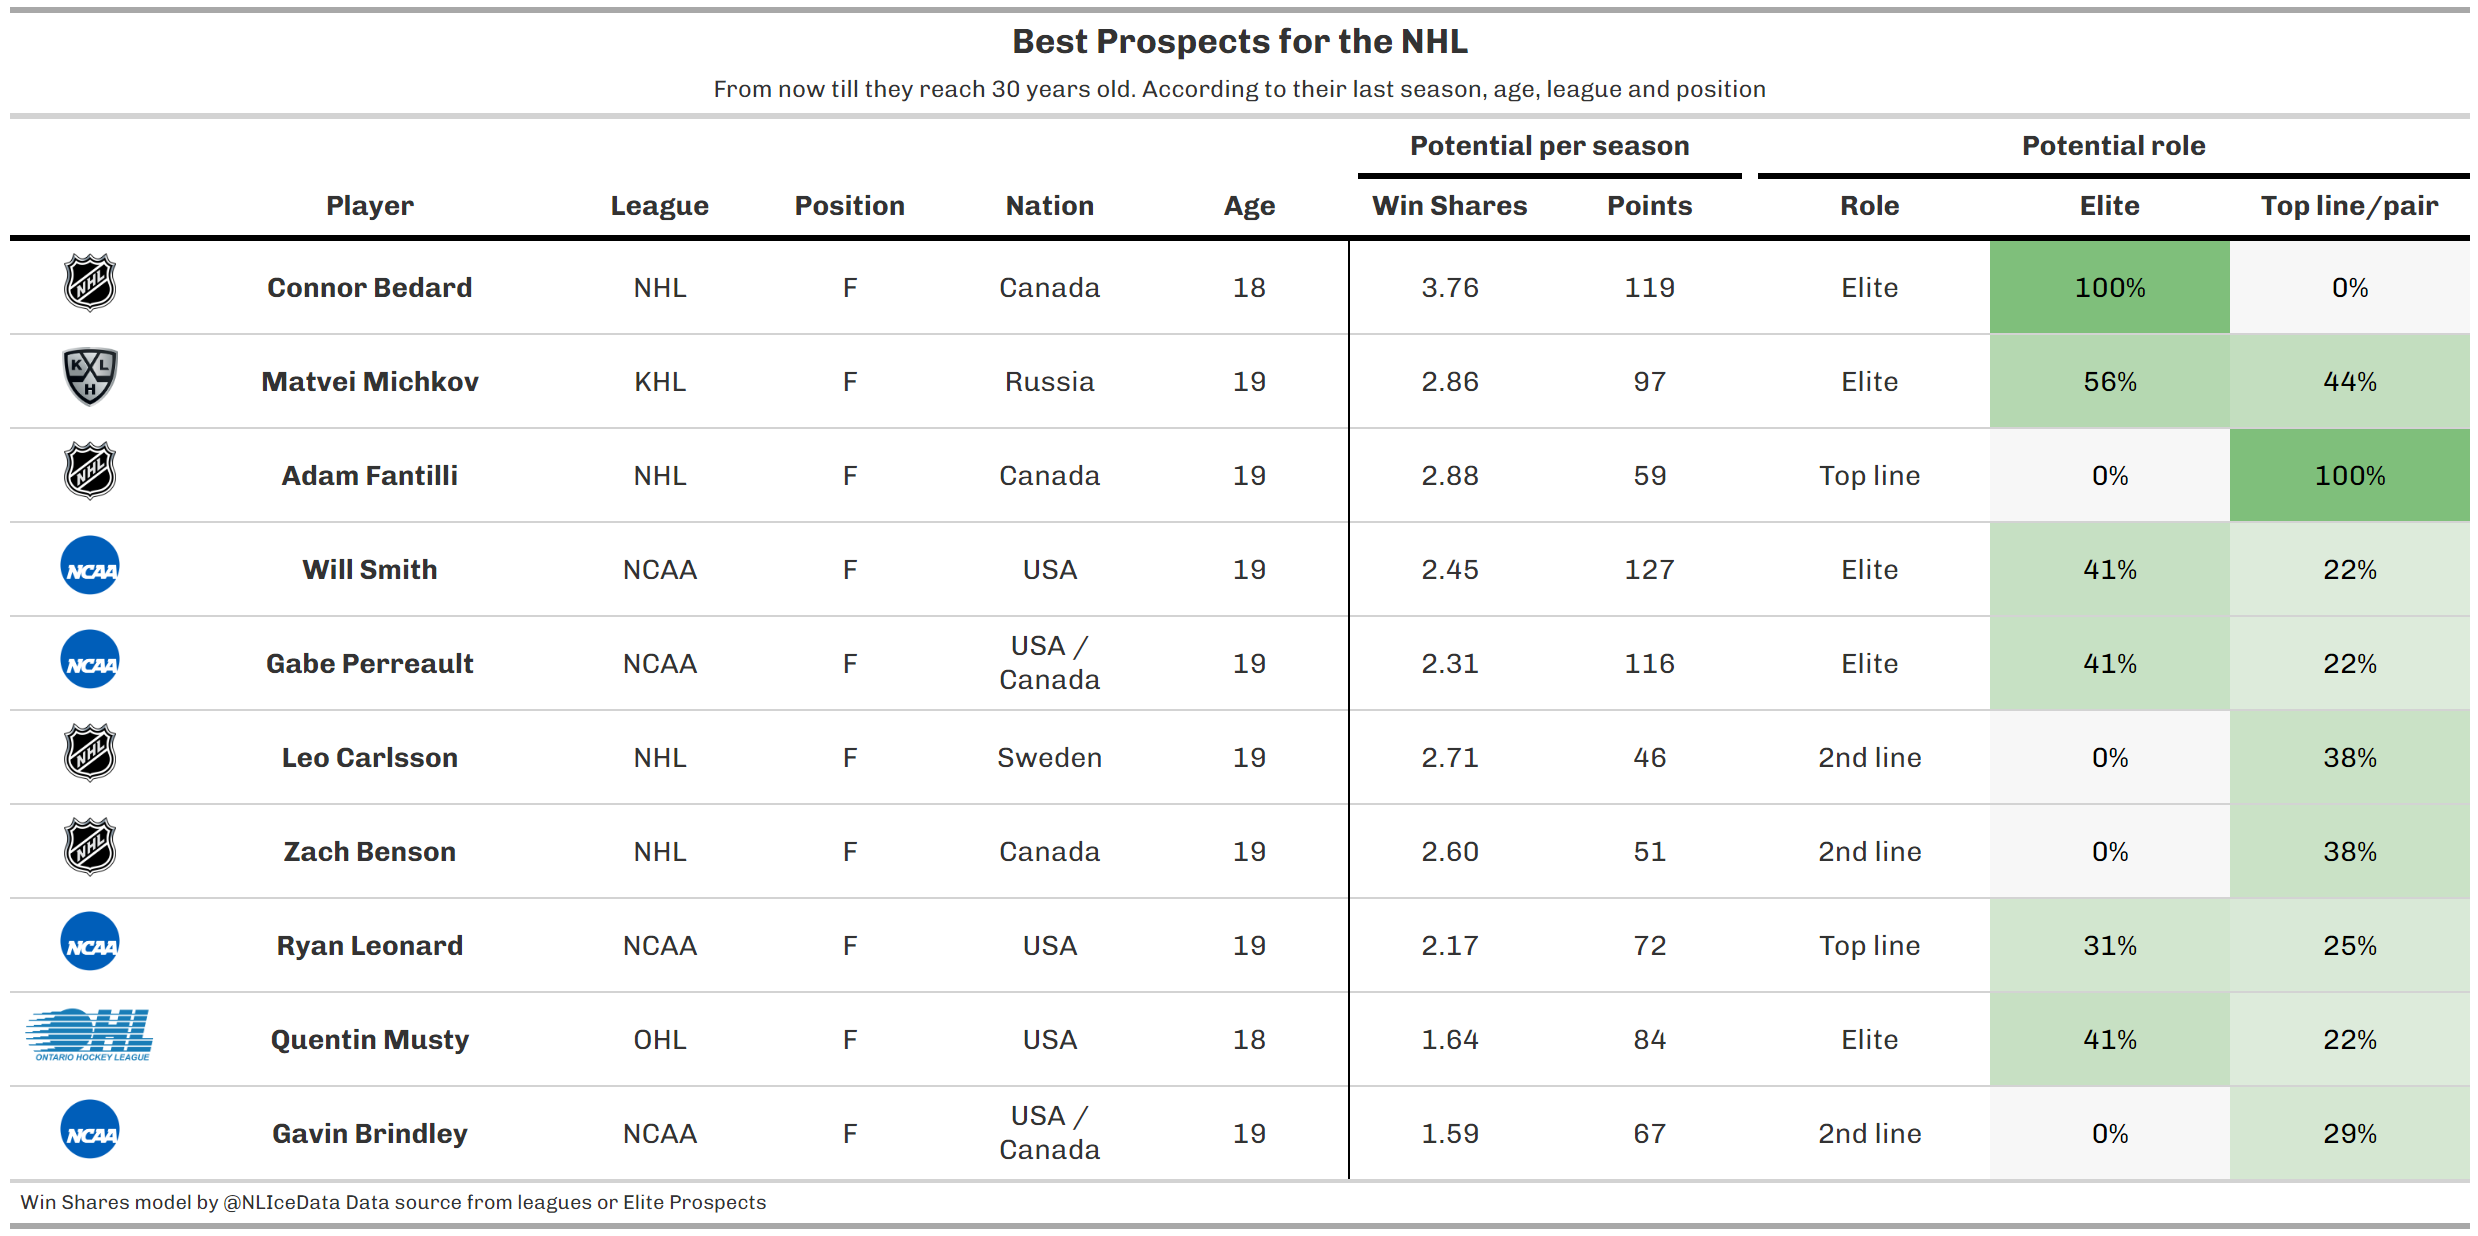
And how is it looking one year later?
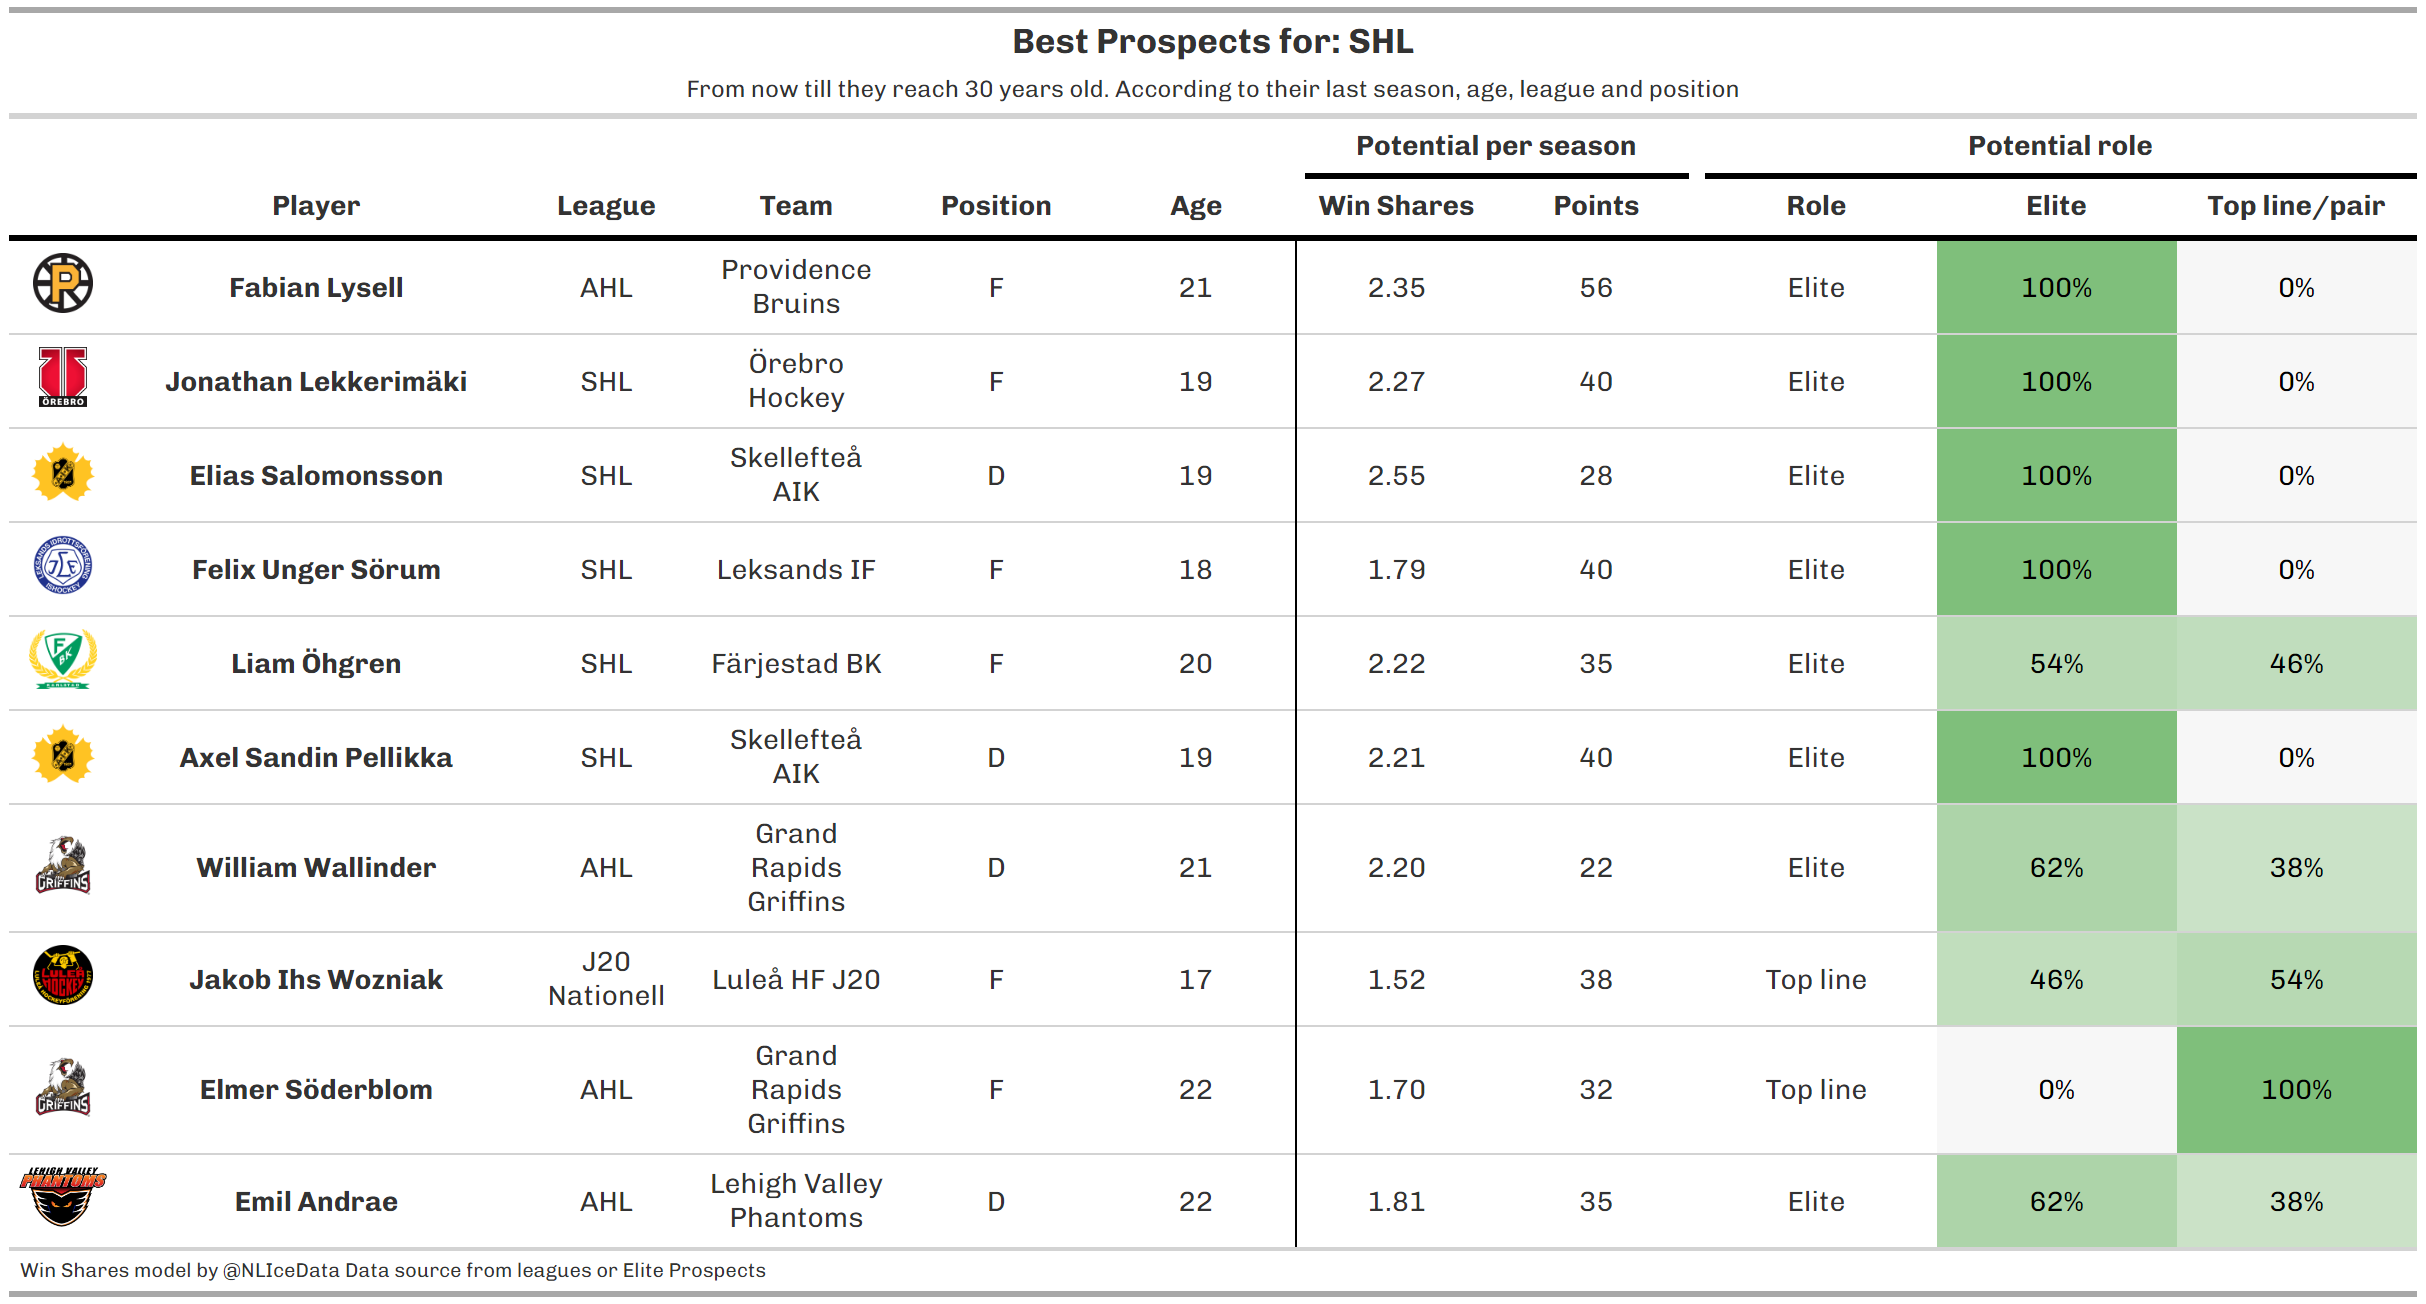
Who are the best prospects for Sweden (outside the NHL)?
There you have it, a source of information to be paired with all the other information a hockey organization would have. Like 2024 Mac Swanson with his impressive stats but… his 5’7”" 165 lbs physique.
Hope this was a helpful update, sorry we missed the Draft. Also, we discarded the Draft model in itself, only keeping that one model instead.