The question is now an old friend for most hockey fans. How can we compare the performance of a player in Finnish Junior league with a player from the USHL? Or what’s the equivalent of scoring 50 points in the ECHL for the German DEL?
We tackled this question last year with our Selective Network NHLe article.
Rethinking NHLe
Note: this article was updated on July 17th, 2023, after every players’ Win Shares from every leagues had been re-run using eTOI, changing individual Win Shares and impacting leagues as well. The question is as old as analytics. How can we compare Connor Bedard’s 143 points in 57 WHL games with Matvei Michkov’s 20 points in 30 KHL games? What about Ayda…
But a couple of thoughts came by since, and here is the result…
What’s new?
Two things have philosophically guided us to tweak our NHLe. The first of which is time.
For starters, we now have era-adjusted goals, assists and points to use, based on the process detailed in a previous article. Because 1 point in a given league in 2023 is not necessarily worth 1 point in the same league in another season, and we now account for that.
Second “time” thing, we moved toward a 5 years rolling NHLe process, instead of using all seasons together since 2008 (where our database starts). As we know, leagues change, the hockey landscape changes, what player goes where at what point of their career changes, etc. So it only seemed logical to focus on the most recent data to analyse a player from 2024.
To be fair, this has been triggered by recent researches on the evolution of NHLe like Chace McCallum’s on the KHL.
Why 5 years rolling? It is arbitrary but we needed a big enough sample of players moving from one league to another in order to study what happened there. One year of data was unrealistic and spitted out huge swings due to the tiny sample sizes. Same for 3 years rolling. 5 years it is then, meaning a 2023 NHLe, calculated at the end of the 2022-23 season, is using data from 2019 till 2023.
Using the Selective Network NHLe designed last year, here’s how the main leagues are changing over time, with a clear, explicit decline for the KHL.
Quick digression here, but all major leagues are going down, compared to the NHL of course. In other words, the NHL is getting better and better. Why? Well, for starters, the NHL has added 2 teams in recent years, and 2 AHL teams, so that’s about 80 regular very good hockey players taken away from the other leagues. Furthermore, NHL organisations have now understood the value of having skilled players on their 4th line and 3rd defensive pair, instead of muscles and grit. That also drained talent away from other leagues more than before.
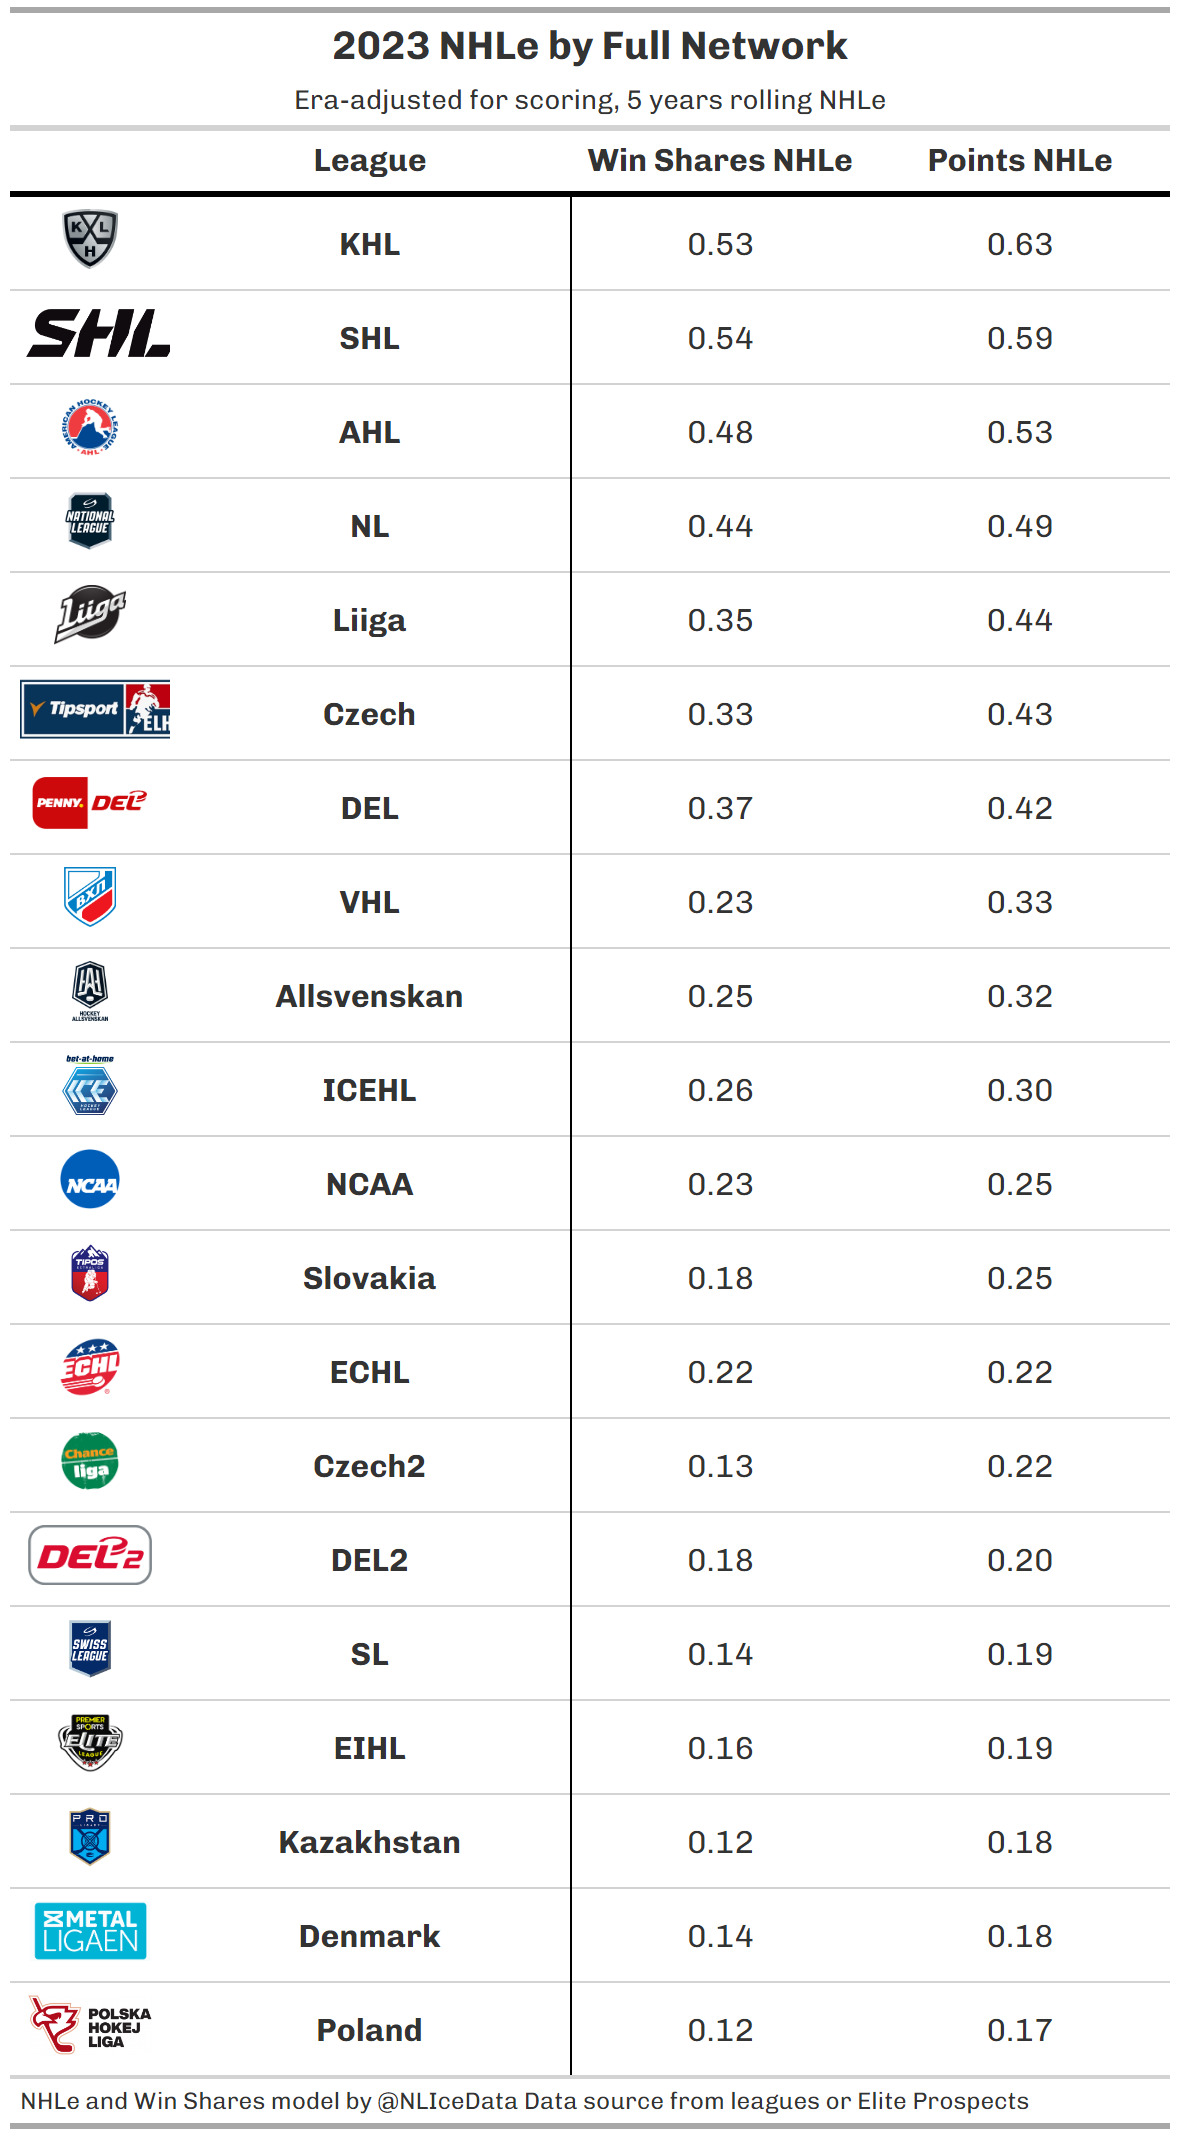
In our previous work, the KHL had a 0.71 NHLe on points, using all data since 2008. Now it would be down to 0.59 in 2023, when an evaluation Matvei Mitchkov for instance should have been done.
So time is an important input. But we did not stop there.
Full Network NHLe
Instead of the end product, the Selective Network NHLe is now only a stepping stone for the new process.
The second novelty in our thinking was (like often with us) to take a step back and see the hockey world as a whole, instead of a ladder built toward the NHL.
NHLe are kind of always built to follow the principle of a progression upward, aiming at the NHL, and that’s exactly what we did last time, only using players moving toward a better league. The NHLe for the SHL was calculated using the players going from the SHL to either the KHL, AHL or the NHL directly.
But using the players moving up means only using the best players of every league. Though the best players of a league might tell a lot about the average value of said league, it is still a small sample size.
It also limits the evaluation of a league according to the path leading to the NHL, and for some leagues like the DEL or the NL, said path will be very limited as those leagues do not see a lot of foreign players going in or out for structural reasons. And should the value of the DEL be defined by the handful of guys going to the AHL, SHL or KHL every season? We think not.
The answer to that is to look down, toward “lower” leagues, defined as such because players from the DEL perform better once they got there. For many countries, it means the national second level league, but also adjacent leagues living in a close eco-system of regular exchange of players. Full Network NHLe had been visited in the past by C.J Turtoro, and it was already a great inspiration to our previous work.
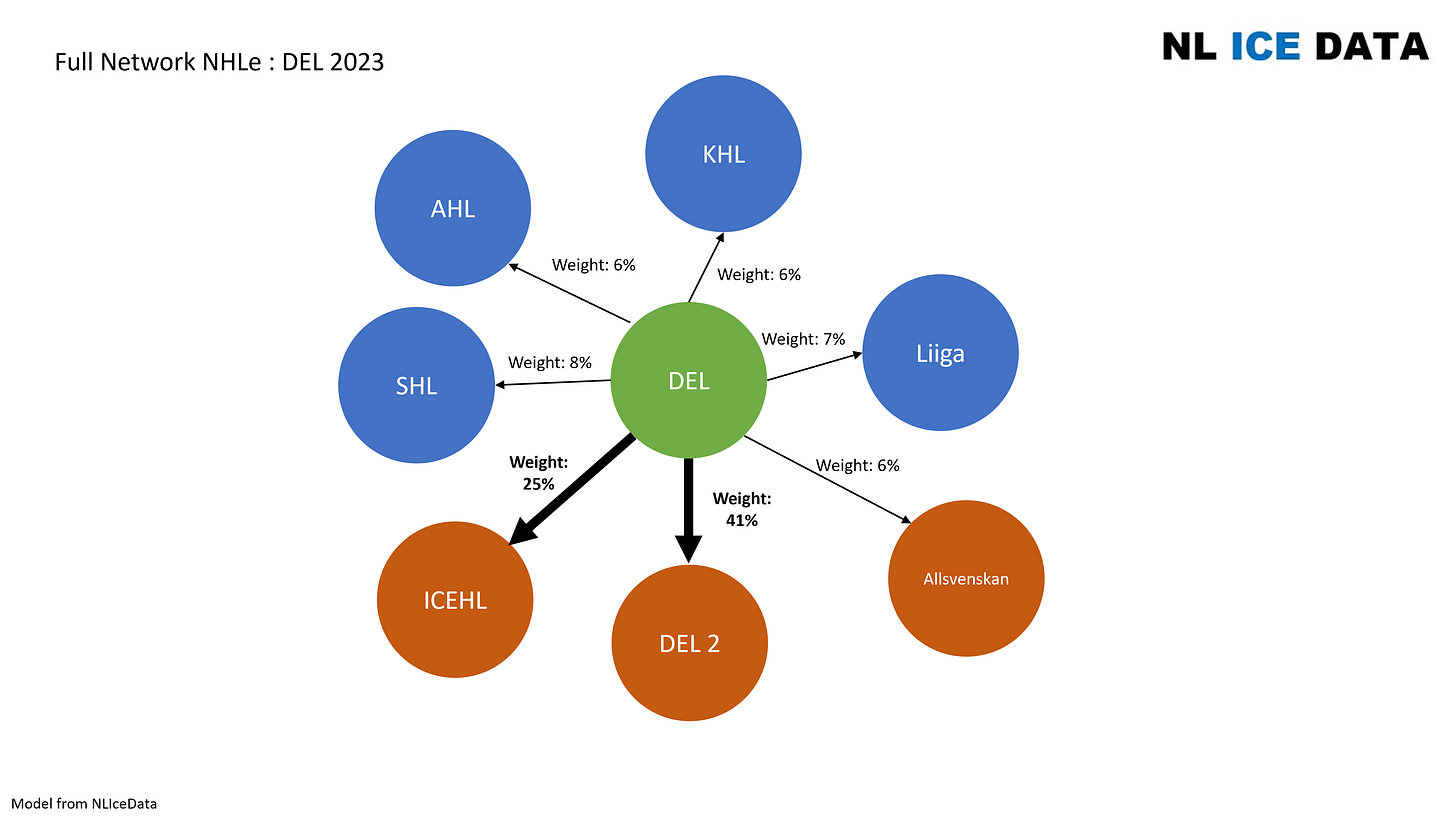
For our 2019-2023 (5 years rolling) DEL, 231 players had moved from the DEL to another league, but only 64 went upward, while 95 went down to the DEL 2, 57 to the Austrian ICEHL and 15 to the Swedish Allsvenskan. Suddenly those links downward represent about 70% of all players movement from the DEL.
And if we take a global approach to the hockey eco-system, it is only fair. The strength of a league is defined by how players perform when they go there, but also how they perform when they leave, no matter where they go.
Let’s take the example of the Swiss NL, and its relation with the national second level SL. A player going down from NL to the SL can expect in 2023 to see his points production per game almost triple! Compared to a 2.4 factor a decade ago.
And the same growing gap is also visible between most of top and second level leagues around the world.
So the NHL is pulling away, but it does not mean the rest of the world is crashing down on the lower leagues. It does not work that way and including the performances of playing moving to lower leagues should help clarify things a bit.
Back to the German DEL, its 2023 Full Network would look like this:
Full Network Calculations
Now, we are not starting from scratch here, and could probably call this an adjustment to the Selective Network NHLe as we are using the previously defined NHLe to calculate the paths for the Full Network.
For example: the DEL has a 2.37 coefficient on points for the 95 players that went down to the DEL 2 between 2019 and 2023.
We’ll do that 2.37 * the DEL 2 NHLe of 0.196 = 0.467. So the NHLe of the DEL according to its relation with the DEL 2 should be 0.467, with a sample of 95 players.
Doing the same for every league in the network (AHL, SHL, KHL, Liiga, ICEHL, Allsvenskan, DEL 2), we average out the results by the weight that each link represents.
The end result is a 0.418 NHLe for the DEL, compared to a 0.402 using the previous Selective Network NHLe.
Overall, most top leagues are improving their NHLe a bit by using this method, and we interpret this with the fact they are also pulling away from second tiers leagues.
But it is limited, and we are not rewriting history here. Just trying to be more relevant. The KHL is still going down, Liiga as well, etc.
Is it more relevant, though?
We tested it by comparing these Full NHLe to actual direct links between two leagues, like we did last time last time. Meaning, if we compare the NHLe of two leagues, say Poland (NHLe 0.174) and Mestis (NHLe 0.159), we can derive a coefficient for players going from Poland to Mestis of 0.174 / 0.159 = 1.09. If we want to compare these coefficients derived from NHLe values with actual coefficients existing between two leagues, using leagues with at least 20 links between them, we get a r2 = 0.95.
It was 0.93 last year with the (not era-adjusted nor recency adjusted) Selective Network NHLe, and it beats the 0.94 we get with the era-adjusted Selective NHLe from the beginning of this article, a marginal improvement but that repeats itself every single year since we can test it in 2012!
Conclusion
We hope to have brought another layer to evaluating leagues.
Timing is important. Comparing yourself to everyone around you is important. It gets the picture a little less blurry.
Now let’s apply those Full NHLe to revisit previous NHL draft years and prospect development models, waiting to be able to establish the 2024 NHLe.


